

















Asteroseismology enables model-independent determination of stellar radii and masses for thousands of G-K giants using scaling laws based on the large frequency separation (Δν) and frequency of maximum power (ν_max), which relate to stellar density and surface gravity respectively; this technique allows astronomers to study stellar populations, derive ages, estimate mass loss, and investigate galactic structure by analyzing oscillation patterns in stars across different evolutionary stages, though careful calibration against independent measurements and consideration of chemical composition are essential for accurate results.
Ensemble Asteroseismology, Clusters, and Scaling Laws
Added:Fundamental concepts of stellar structure and evolution, including the physical mechanisms of the Hertzsprung-Russell (H-R) diagram.
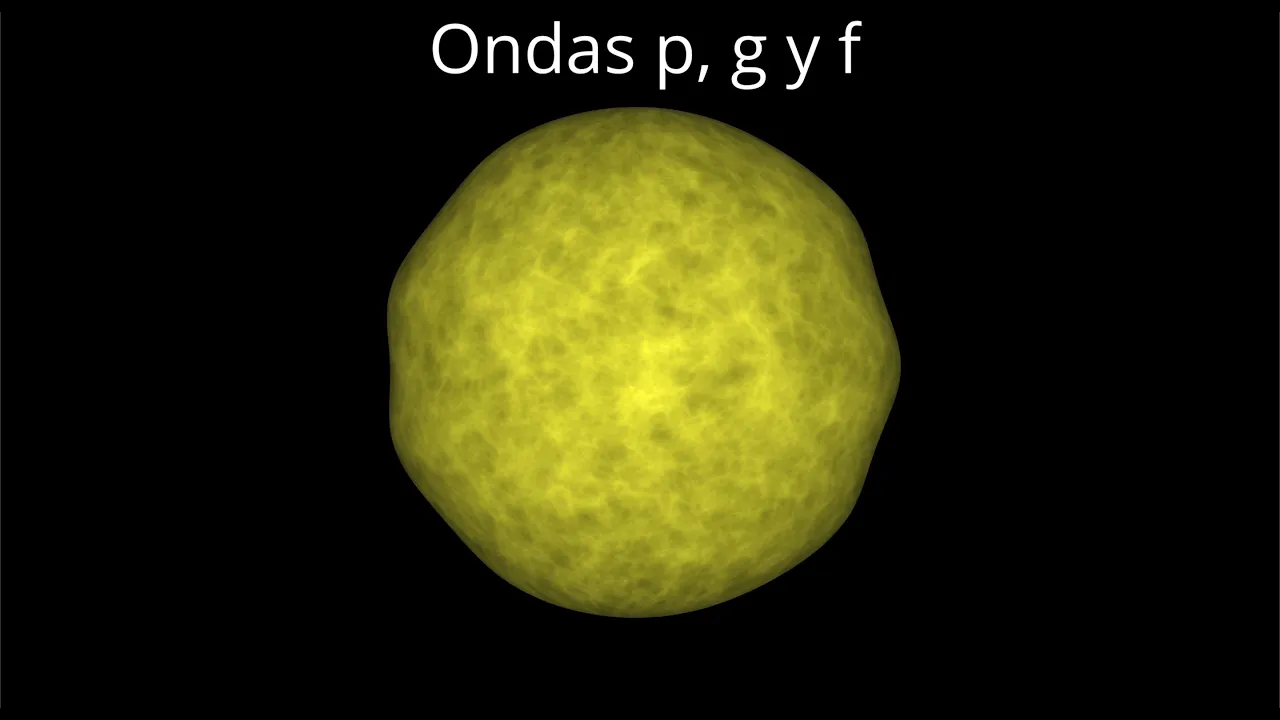
Basic principles of asteroseismology, specifically how acoustic (p-mode) and gravity (g-mode) oscillations propagate through a star.
The astrophysical significance of star clusters (open and globular) as coeval stellar populations with uniform age and chemical abundance.
The basics of observational astronomy, particularly how space-based telescopes like Kepler and CoRoT perform high-precision transit photometry and frequency analysis.
Galactic Archaeology: Using seismic properties of red giants to map the age, chemical history, and structural evolution of the Milky Way.
Synergy with Exoplanetary Science: Applying precise stellar masses, radii, and ages determined from asteroseismology to characterize orbiting exoplanets.
Advanced Stellar Modeling: Refining theories of stellar interiors, such as core overshoot, rotational mixing, and magnetic fields, using seismic constraints.
Next-Generation Missions: Analyzing how current and future space telescopes like TESS, PLATO, and Roman build upon Kepler's ensemble asteroseismology legacy.
258 views1likes29:10Original Release: 2014-10-21
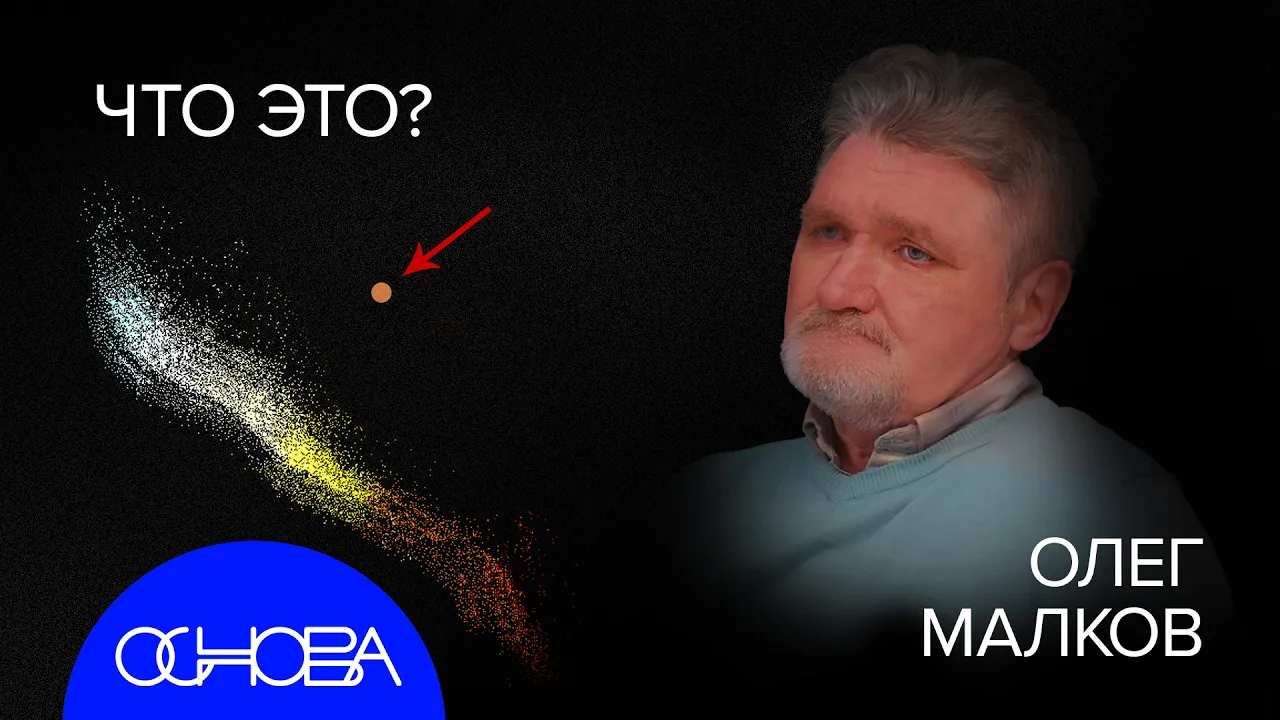
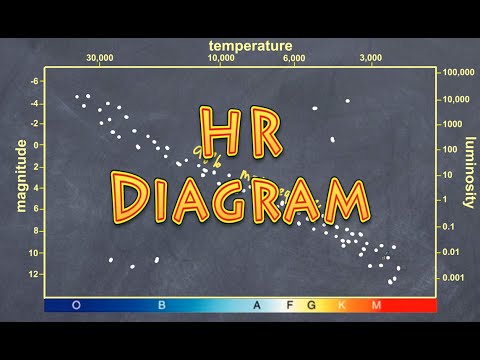
so I after the the introduction the speaking about the importance of the red giants in the in the revolution of the of asmy I will speak about the the possibility to to study a lot of Stu at the same time so you see here the the AR diagram with the pator that there is all in the in the main sequence and post main sequence and uh you will show all these variables during this days but they will speak mainly on this part of the diagram that is solar like oscillators that they have period that change from minutes to hours they are excited by the they are excited by the by convection that is in the in the in their envelope they also damped the amplitudes they are small depending on the on the evolution but they they go from PPM to tens of PPM they present acoustic mes radial and non radial this was the novelty and in the sub Giant and Giants we have in in addition to acoustic modes also PG mod mixed mod that have the possibility to sound the interior and external part of the star and that is that is what the situation before K and kep that was the Sol illat that was detected after a lot of work and you see here that is not the people who who discover observe this this sty was the people that has published things about this St many people for so so a small number and that is the situation after Keo have here the I diagram in with the oscillators in observing the field of G and here those Ino and you see the numbers we haveif 500 D of giants in Kepler field and several thousands of Giants and on the other hand in coo we have also a lot of R Giants in the exoi and some bright Giants and S are like stars in the in the sismo FI so brighter Stars so we have all these stars that present all of them more or less the same behavior that means the the power Spectrum present this this shape like that of the sun present one comine spectrum that means that we have the the acoustic mode or the radal B equally spaced by one quantity that is the what we call the large frequency separation that is well there is one ER is the the here through this s c so the sound sound speed that is the two two times the the time that the the perturbation takes to go through the star and it's usually um said that this equivalent to the the square root of the main density of the star we will see after about this the this oscillate the PO Spectrum present one gaussian shape with the center or at one frequency which we call a new Max that is related to the frequency of cut off and we can relate it for an ismal atmosphere to the ratio between the gravity and the temperature effective temperature the square root of it so that is what we call the the basic scaling lws there is also other scaling lws that relate the luminosity and the mass H and they are more important to study the energy of the mous the exitation the the characteristics of the interaction between the pation and the convection but I will not speak here about that so what what it was interesting also from this spect is a studies and they the behaves actually as we we you expect from the from their radius of main density and you see that as we go from the dwarf very dense here and after we we evolve with the radi that increase the main density decrease and we see how the the the Spectrum the frequency of of maximum of the Spectra change with the Evol with Evolution it's exactly what we expect from this from the from the ratio between the gravity and effective temper that is in fact the the radius who do dominate that is for the St that are in this part of the HR diagram and uh I I speak also only before about the scaling relations concerning if you want the radial mods but this start present also known radial modes and there is a asymptotic relation that allow us to express the frequency was mode non radial mode as some function of the main large separation with the the quality of equ spacement but there is also another quantity here that makes that for this mode the the distance is distance between L um between different LS is not the same so this quantity here we can write it as the derivative of the Sound Speed near the center is especially important there its contribution near the center and is this the the separation that we you see here between radial mode one quadruple mode for example and that is for start that is not variable but as the start evolve and the there is one increase of the density contrast between the envelope and the center the start the the start increase the radius at the same time that the core contract that make change the the properties of the propagation cavities inside the star and what happen is we will it see to appear as what we call a Mix Mod first at the beginning and the at the end of the of the main sequence and after that when the dens city is in the center is really big we see that the frequency of the gravity mode that is smaller than that of the acoustic mode are right at the in the domain where the acoustic mode propagates what happen is we will we see in the same domain of frequencies B modes acoustic modes and also gravity modes and the gravity mod behind on the other hand showing one equ distance in Period instead of in in frequency and uh the quantity of this equid distancing period it also depends on the density in the central part of the star so both from the h small separation from the perod spacing for various Evol star we we have one indication about the density contrast between the envelope and the center and that was is one sign of the evolutionary State and so on in on the age and as if we continue the evolution of the star from we in the Red redon Branch we see that the new Mas continue to decrease but we see also if you remember the the previous FL that the the Spectra also increas in complexity we see that appears a lot of M between the what we call the the acoustic ones so if we what is surprising is we able see the this power Spectra we are able to to see exactly what is h is happening in the star from the beginning where the the star is more or less homogeneous after when the it begins to to contract the core at at this moment the the the envelope and the core evolves in the one contract other spans and increase the the difference between the properties and the one on the other the two cavities are more and more uncoupled and we recover one situation more or less as when we have one simple star in the main sequence and after that when the star evolves again and recover another situation with another stru that correspond to the H nuclear reaction that begins in the center we recover one one sign of what is happening in the interior of the St so we have all this information of a lot of this star we have information on the main density and also on the density contrast that in fact is one indication of the of the evolution of the star so what we can do what with of that first of all from the the two basic scaling relation we have the possibility to derive once we have Del Max Plus the effective temperature we can derive the radius on the mass and you have seen that we we are able to have the radius of the mass for one big quantity of stats that in that are in the field they are not binaries they are not in clusters and that is in fact almost incredible to be able to to derive um Stellar parameters for um for this for this kind of of targets uh in fact when we want to do that we use uh we use clusters we use binaries but it's not possible to do it in the in the field but with this parameters what we can do we can do a lot of things first of all as you I I told you to to have mass and radius for one quantity of star in the field is it's one gold mean if you want for study the the Stellar physic and also gal Galactic Evolution we can of course to derive the parameters of the planet and U there is one very basic thing we can derive the the the gravity of the star in the at the surface that is one very important data for the people who do oscopy because there is the gener the genery between effective temperature and gravity when they do the analysis of the of the Spectra and using the the Gravity from cisy that is more is much more precise they are able to improve the their derivation about the atmosphere parameters that is one of the reason why we have finally have a lot of success with the people who do spect spectroscopic surveys large spectroscopic surveys we we provide them the Lo the LOI and they will provide us with the composition of the stuff for example we can also to do a study of ster population both SLE for example and cluster or when a one composite St population like for example the Milky Way or the disc of the Milky Way we can't uh um discriminate between members and non member of clusters because they they have to follow the isocon they have they have to all the must have the same age and U is is we can um only from the from the velocities in the field we are not able to to do it so clearly is possible since we are able to derive the mass we can obtain estimation of the of the mass loss that is one data very uncertain in the in the field and there is parameterized and we don't know there is not a lot of constraint and finally we have also the possibility to use the this data as distance indicators mean we have the radius we have the effective temperature we have the luminosity and so we have the distance of the St and again before before guard we will be able to have one estimation of distance that is not again is not possible to obtain for stars in the fields in the field also only in a cluster or in in binaries for example um one one one quantity that is very is very interesting for the H for all of us is the age of the stars in order to study the evolution of the of the Stars evolution of the planetary systems of the evolution of the Galaxy and um one possibility that gave us the the rean is to derive the a from the from the mass because it's one good proxy of the of the a but still is a little model dependent it's model dependent but not so much as for the for the DW in fact you have here what is the the dependence of the AG of the red giants as a function of the mass for different the color indicates the the chemical composition and you see here that for 1.5 solar masses you have you can estimate the the age between 9 point in log 9.3 9 9.5 more less but if you know the and you see that follow one very tin relation and um if we add the the knowledge of the of the chemical composition we we reduce the the uncertainty on the on the age until 15% so again to know to have this information to to study the evolution of the of the the formation evolution of the Galaxy using the the the red giant is one of the the objective that we that we have and the in the in the group that we in which we we work in the red giants in by comparison you have the same thing here but for the for the stars in the main sequence to see that there is one large discrepancy or uncertainty in the in the in the mass sorry in the age because in the during the the mean sequence there is a lot of factors that influence the the determination of a in in particular the mixing processes that we don't know how how they work and how much important they are let's say we can constraint the the mass the mass loss usually you use one law empirical law from R and using the stars in the in the cluster the St that are in the fgb and in the in the red clamp and estimating the the mass in the RGV and the mass in the in the red clamp we can see the difference between the one and the other and so to have an idea of the interr mass L during the theed red GI Branch evolution so the possibility I what I told you was the possibility to to do studies of the Stellar population and you see here are the the Star located in the in the galaxy in the over the pl over the plane and on the on the dis and you have here different colors for different rounds of coo and also the green one correspond to kler and for the with the first run for which we have around 2,000 r with with Sy mology you was able to use this data to derive mass and radius and doing simulation to estimate what are the Distribution on mass and a on mass and radius in one side and the other of the Galaxy in the center and the anticenter and what um what it results is that we have one difference in the different in the distribution of mass in the in both sides and so that see it's indicates also a difference on on age nevertheless I have to say that here we have also the estimation that we do of the on the age we have to do simulation because we don't have an idea for the moment about the the the aces of this St star because first of of of all we don't have a chical composition and uh so and in this moment we didn't have also The evolutionary state so we have I told you one one series of things that we are able to derive using only this very simple scaling relations but the problem is they are through or they are through in which doain in which range so one possibility to to study if this relation are good or not is first of all to to derive the the lar separation for example from uh from models from frequencies and compare what what if to see if in fact that give us the main density or Not Another possibility is to do independent measurements of radius and mass as I told you that there is one limited um range of situation in which we we are able to do that so lastest H binaries and uh for the first um for the first test the the models what I show you here is what we the comparison between what the SLE scaling relation tell us about the main density and as a function of the new Max so the evolution of the St for different masses for low mass.7 until 2.4 during the fgb and um on the during the the central Alum burning phase so the red clamp and what we see here first of all is that there is the even during the the RGB they don't follow the line equal one that will mean that we have that Delta new is in fact a good estimation of the mean density and but we have also that the the difference depend on the mass depend on The evolutionary State inside the evolutionary State depend on also in the mass and uh if we do the same computation with different chemical composition we often here the data corresponding to one metallicity 10 times smaller than the solar one and we see that depends in the the mass in the Stellar um in The evolutionary state also in the chemical composition so we have to take it all this into account in order to exploit the the data we have we have also the the possibility to test the for examp the radius in the m and the mass and using nearby Targets that that are known or using interferometry using paralax for some of stars that are know and use the the start in the in the cluster observed by by K doing all this kind of things we arve to to one agreement for the radius in the order of four 4% and for the mass is is a not so good it's 10% and there is also one systematics in the what I understood from the eing binaries is that on overestimate always the the mass with systemology with respect to the to the what give us the the V but never the it's not so bad so M and radius we are not so bad but what about the what about the the age how I saw before that the the age depend on the modest and the the principal the more important things are first the the mix in the C H the mixing processes and also the evolutionary State and um I show you here only what is the the density distribution when we do one study of the population in to identify the the age of one star if we don't know the evolutionary state of the star we have two Maxim two PS and nevertheless it's very large the domain of of data so it's important to know the evolutionary state and what I show you here is that from no radial modes so for from the small separation that I showed you before that behaves differently in the LGB right here for one solar mass and here for 1.5 that in the in the Alum burning phase what you have here the behavior and you see for example for Sol there is one difference between this position and this one concerning at the same that separation concerning the the value of the small separation of one so again I recall you that small separation depends on the on the central density on the density contrast and so we can use the small separation from between radial and quadrupolar mod to estimate or to discriminate The evolutionary State there is also the possibility to estimate the evolutionary state from the P spacing of theole mode as I told you before that the the the in these phes the appears the gravity mod so the mix PG gravity modes that they have to show one um separation that depends on the concentr concentration density contrast in the St and the density contrast change when we are between the phase where we have in the fgb where the the core is very very very dense is the generate and the phase in which we are burning the alium and we are able that are the rest from Kepler and we are able to discriminate between the two situations and that is the more recent result so we have the possibility with the PO M and also with quadral mods and from the also from the non radial mix mod we are able to estimate properties about the the mixing in the St and there is one relation relation if you want between the period spacing and the mass of theum core and the this this relation that you saw here is the same with um if we use overshooting or not in the in the during the main sequence and uh we know the the mass from the the region we know the perod spacing and so we know where we are we the standard is here what is the mass and uh the mass that we have in this position in the minimum um mass of theum core to begin the the the Arium burning phase is only determined what what is the mixing during the main sequence so from data in the post main sequence we are able to write the data in the in the main SE and also from the P spacing we can derive the the side of the convective C during theum burning phase so I the scaling relations are have an enormous potential and in particular for the study of Stellar population but we need to calibrate them uh this relations for example with binaries for example with parallaxis the par will as the relation with the radius is good or not and here I show you what is the expectation for GAA for the this the magnitude of the radiance we have in in C field and so we see that depending on the distance we are able to to have the distance with one the with quite good uncertainty and one thing that appears several times in the in this presentation is the need or to the to have the metallicity the chemical composition to to exploit really this data and U that we will we will have thanks to the collaboration with large um spectroscopic service like apoena and Gala all of them has begun already to observe both K and thank you thank you very much so we have a time time for a few one or questions depending on their length I just wanted to make a comment on your diagram using models to test uh large separation against mean density I did that calculation several years ago using your models right from uh your website and I got a much larger spread particularly for low Zed I think is 006 in your lowest case and uh mass is up to 1.5 up to 20% but it was Sor but it was only main sequence model what I have in the yeah sure that so I test it with main sequence models and it went up to 20% for the largest mass lowest density when the largest mass was 1.5 that I used so I got a bigger scatter than you did much bigger for the mean sequence yes yes
Up Next
30:13
Stellar Ages via Seismology: Rotation-Magnetic Activity Relations
@ompvideo
269 views•2014-10-28
61:17
First Billion Years of the Universe with the Square Kilometre Array
@iaaudc
121 views•2022-05-26

6:25
Kepler's Laws of Planetary Motion Explained (Educational Astronomy Video)
@Peekaboo_Kidz
404.9K views•2023-02-17

6:10
Gamma-Ray Bursts: Cosmic Snipers Explained | Astronomy
@kurzgesagt
15M views•2016-07-31
Related Study Plans & Knowledge Roadmaps
Structured learning paths in Astronomy
astronomy
Reionization: Pop III Stars, IGM & 21cm Line
01Foundations of Cosmology & the Early Universe
02Population III Stars & Cosmic Dawn
03Physical Mechanisms of Reionization
+ 2 more learning modules
17h5 modules
Explore Roadmap
astronomy
Planetary Rings: Dynamics, Roche & Resonances
01Foundations of Gravity and Orbital Mechanics
02Tidal Forces and the Roche Limit
03Structure, Composition, and Collisions
+ 2 more learning modules
10h5 modules
Explore Roadmap
astronomy
Asteroseismology: Stellar Waves, Ages & Cores
01Foundations of Stellar Astrophysics & Wave Mechanics
02Stellar Oscillation Modes: P-modes and G-modes
03Mathematical Framework of Asteroseismology
+ 2 more learning modules
35h5 modules
Explore Roadmap
astronomy
Adaptive Optics: Physics, Engineering & Control
01Foundations of Wave Optics and Wavefronts
02Atmospheric Turbulence & Optical Distortion
03Wavefront Sensing Technologies
+ 3 more learning modules
35h6 modules
Explore Roadmap