




![STD-12 STATISTICS [PART-2] [CHAPTER-5] [DIFFERENTIATION] [DAY-1] - By, Tarun Makhija](https://i.ytimg.com/vi/fdZ2AbUbZdA/hqdefault.jpg)




![[23년6월][고2모의고사][독서33-38번] 독점기업의 이윤 추구 과정 / 공정거래법의 이해](https://i.ytimg.com/vi/B12A-tw-CrE/maxresdefault.jpg)





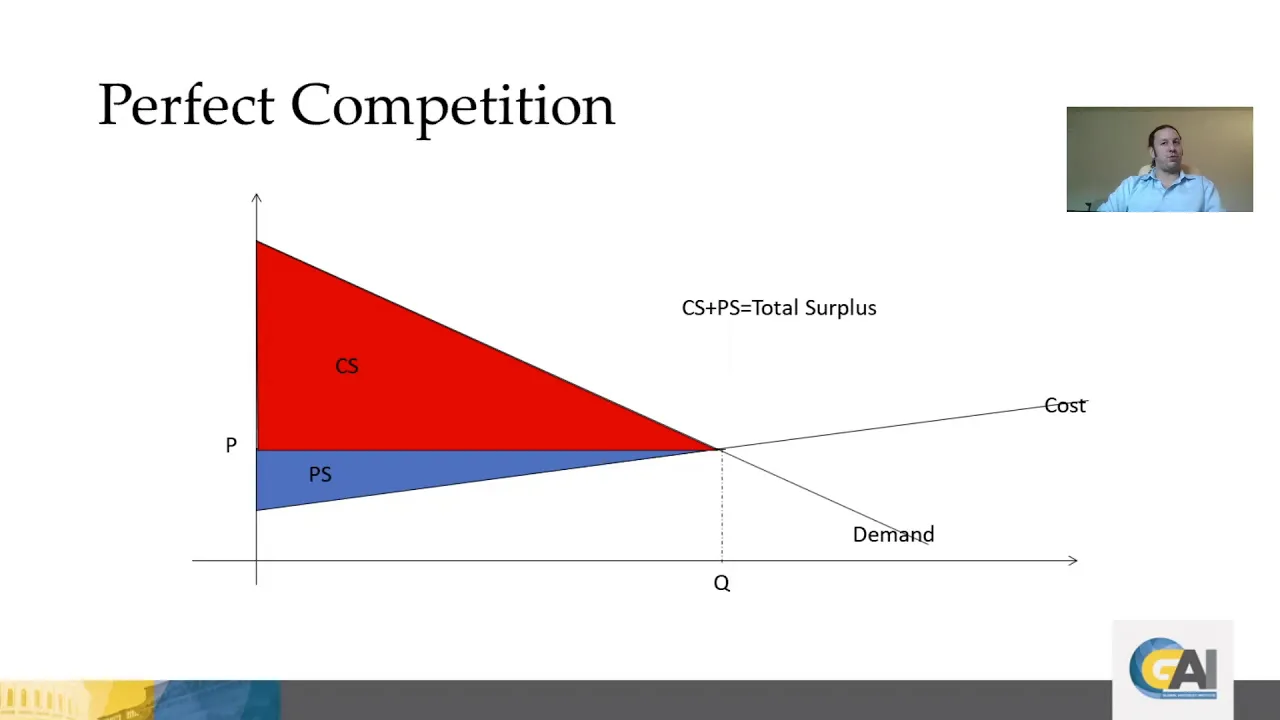

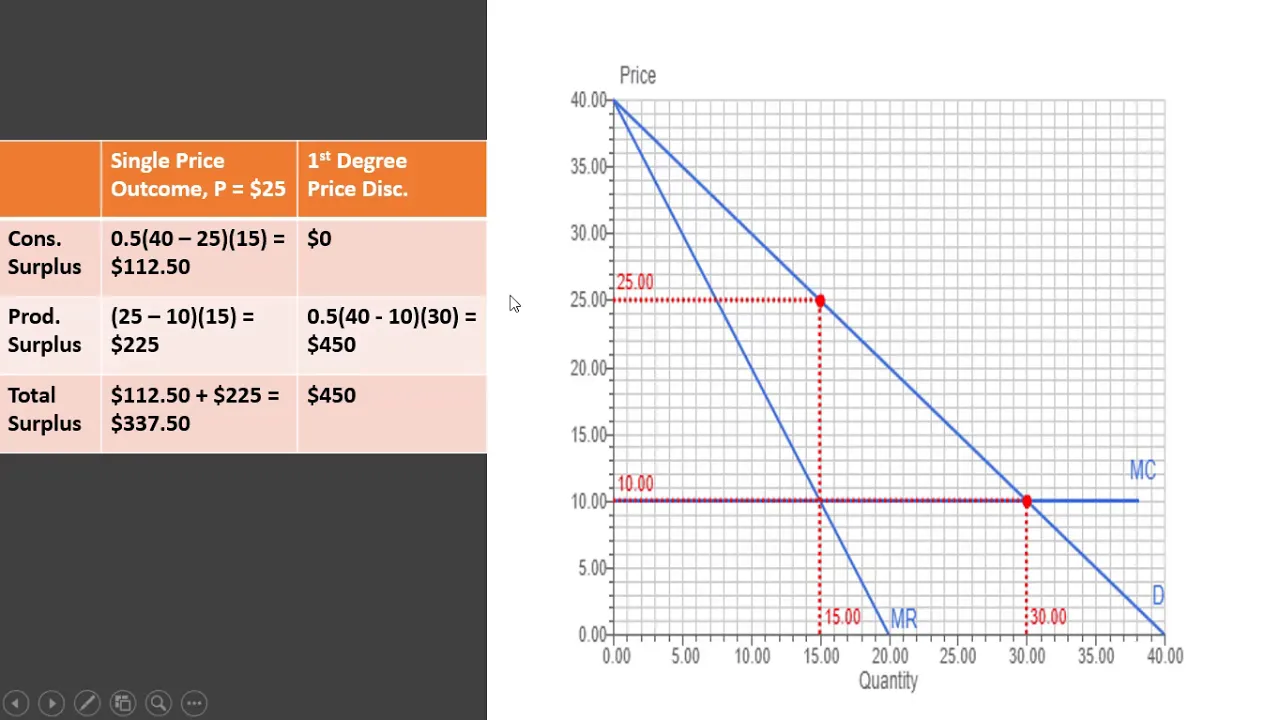

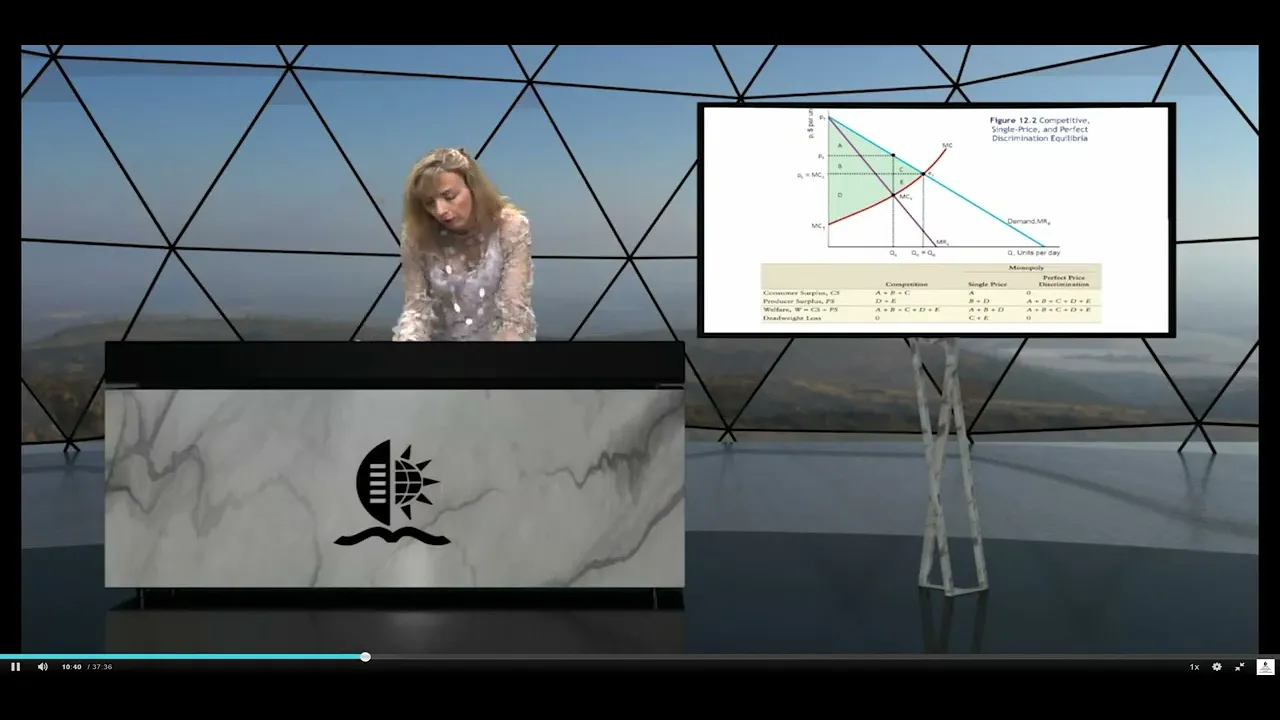


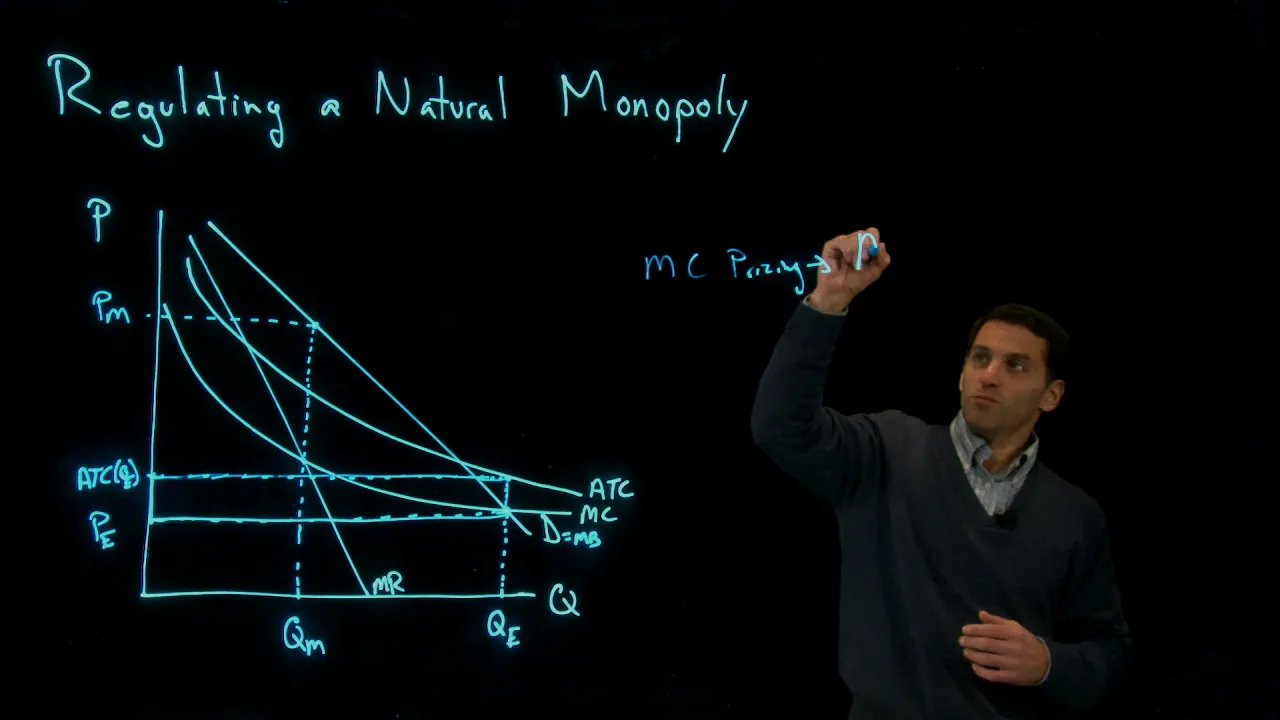

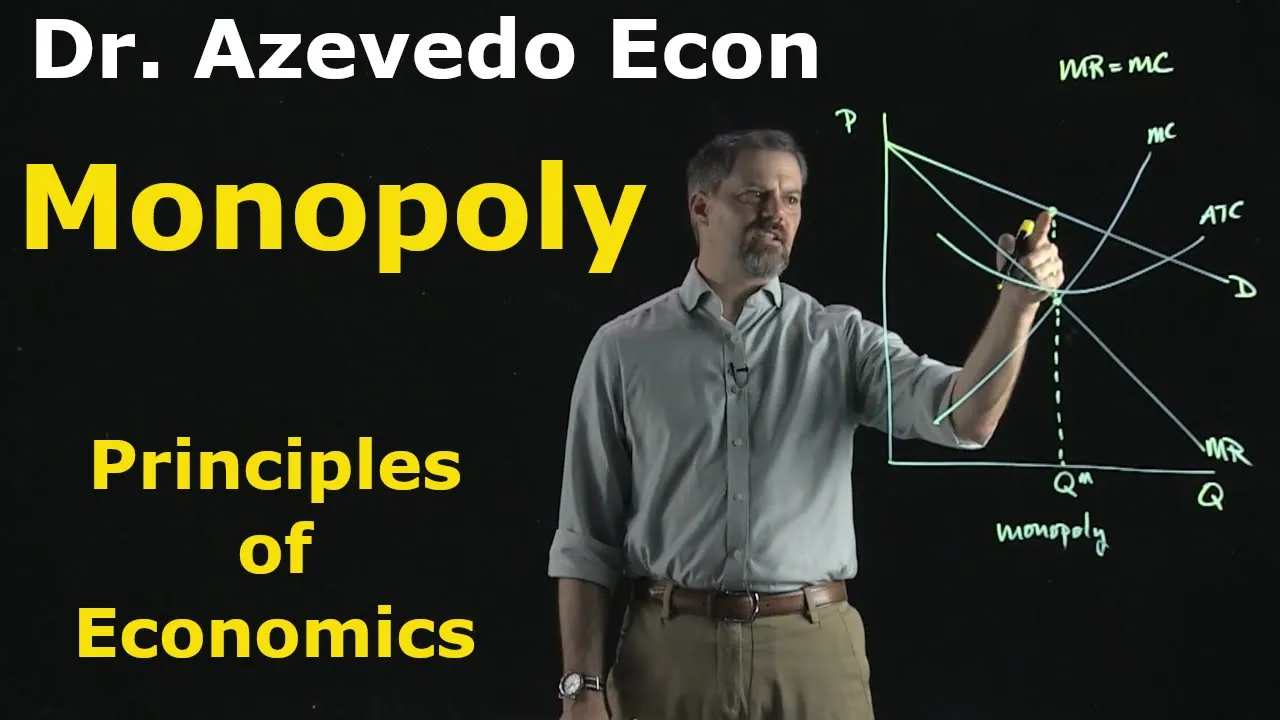






Under monopoly, consumer surplus is the triangular area between the demand curve and the monopoly price up to the quantity sold, producer surplus is the area between the price and marginal cost curve up to the quantity sold (divided into a rectangle and triangle), and deadweight loss is the triangular area representing lost efficiency where consumers' willingness to pay exceeds marginal cost but no transactions occur; for the given example with inverse demand P = 130 - 0.5q and MC = 2q + 10, the monopoly produces 40 units at $110, yielding consumer surplus of $400, producer surplus of $2,400, and deadweight loss of $80.
Monopoly Surplus & Deadweight Loss: Economics Problem Solved
Added:Understanding inverse demand curves and how to algebraically solve for price and quantity.
The concept of marginal analysis, specifically how to derive Marginal Revenue (MR) and Marginal Cost (MC) functions.
The profit-maximization rule for firms (MR = MC) and how monopolists set prices based on market demand.
Basic definitions and graphical representation of Consumer Surplus and Producer Surplus in a perfectly competitive market.
Analyzing the welfare effects of Price Discrimination (first, second, and third-degree) on surplus and deadweight loss.
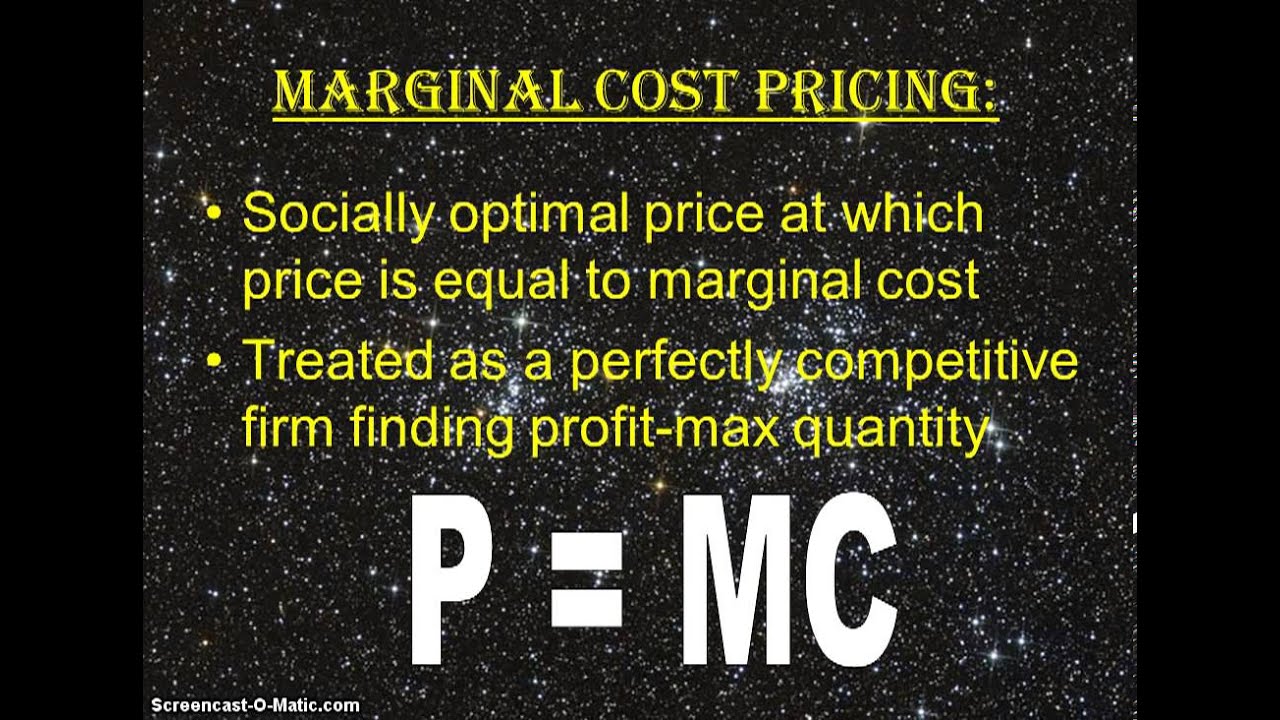
Evaluating government regulatory policies for natural monopolies, such as marginal cost pricing and average cost pricing.
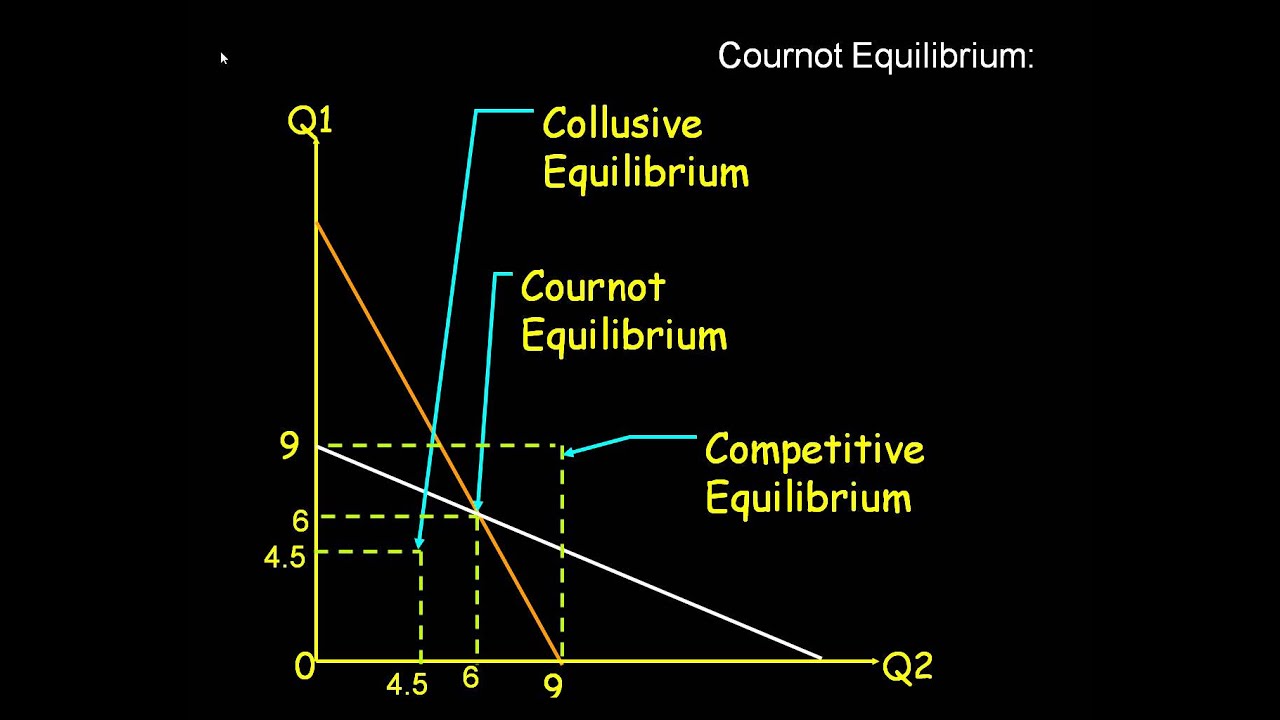
Comparing monopoly welfare outcomes with oligopoly market structures, including Cournot and Bertrand competition models.
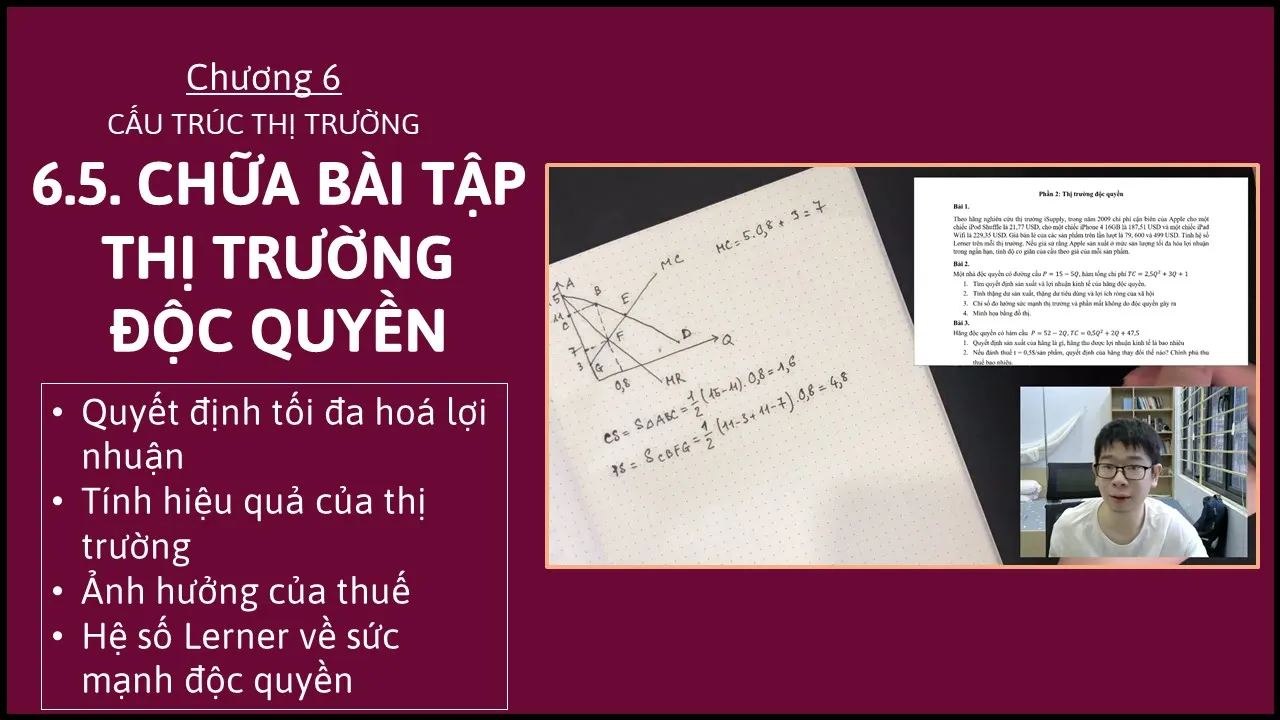
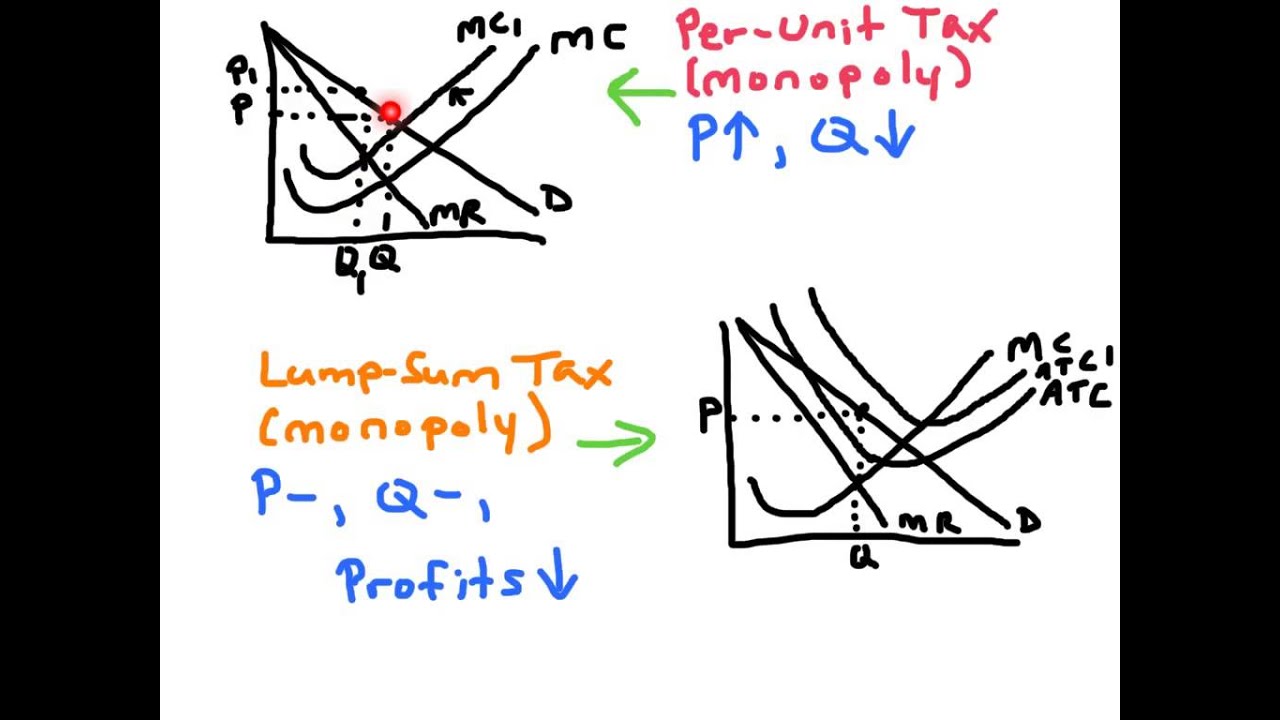
Examining the impact of taxes (per-unit and lump-sum) on a monopolist's pricing decisions and economic surplus.
295.8K views3.1Klikes9:09Original Release: 2014-05-06
in this video we're going to find consumer surplus producer Surplus and the dead weight loss under Monopoly a monopoly let's say has an inverse demand given by 130 minus.5 q p is the price that the monopolis sells its product for Q is a quantity produced the monop has a marginal cost equation of 2 Q + 10 so let's get started the first thing we're going to do is find the profit maximizing output level and price for the monopolist let's begin with finding the monopolis total revenue price times quantity substituting in the inverse demand function for price okay so just substituting 130 minus5 Q in for Price multiplying it through by Q we get a total revenue expression equal to this marginal revenue is the slope or derivative of the total revenue function so taking the derivative of this equation we just get 130 minus Q uh thing to keep in mind is that marginal revenue will look like the inverse demand equation except its slope will be twice as steep so minus5 this is just minus1 Q let's set now marginal revenue equal to marginal cost so we get 3 Q = 120 The Firm should produce 40 units of output to maximize profit and it will set a price of plugging this 40 back into the inverse demand equation we get price equals 130 minus 20 or $110 all right now let's uh try to find consumer surplus producer Surplus and the dead weight loss for this particular fir I find it easy uh easiest if you look at this graphically so I'm going to graph the firm's demand equation it's a linear demand equation it has a vertical intercept of 130 right so just looking back so vertical intercept of the demand equation is 130 marginal cost is 2 Q + 10 so the vertical intercept for marginal cost in this problem is 10 so sketch something like that marginal revenue I'm going to come down something like that technically going to intersect halfway between the origin and where the demand curve intersects and where the demand curve intersects this is actually 260 okay we're not going to do anything with that value though but you should be able to find how that's 260 and it's going to be half the distance so this will be 130 here we found this value here where marginal revenue equals marginal cost we found that value is 40 okay this is not drawn to scale so well but that's all right and then we found that plugging this 40 into the demand equation the firm is going to charge a price of $110 okay so that's where the 110 showing up all right let's uh locate the areas of consumer surplus and producer Surplus consumer surplus is this triangle right here just shade it in slightly so that triangle is going to represent consumer surplus under Monopoly the difference between the height of the demand curve what consumers are willing to pay for an item and what they actually did pay all the way up to the quantity sold 40 so the dimensions of this triangle okay geometry says the area of a triangle is 1/2 base time height so 130 - 110 multiplied 40 - Z and that will simplify down to uh $400 20 * 40 is 800 and half of that is $400 so that's consumer surplus under Monopoly producer Surplus is going to be this big area here the difference between the price the seller where the monopolis is selling the good for and the marginal cost curve up to the quantity sold so we got this area here uh in order to calculate this area we're going to have to divide it into two sections one area is a triangle and the other area is a rectangle so the area of this rectangle just width times length so that's going to be well we need a value here don't we we got to get a value here so to find that value the easiest thing to do is plug 40 back into well it doesn't matter marginal revenue or marginal cost so if you plug this 40 back into well marginal revenue it's right here uh we're going to get 90 so this value is 90 we would have got the same thing if we plugged it into marginal cost marginal cost is 2 Q + 10 so 2 * 40 is 80 + 10 is 90 so now we got an important dim menion and so the area of this uh rectangle is going to be width time length so 20 * 40 so that's 800 but that's not all of it producer Surplus is also this bottom triangle the difference between uh 90 and the marginal cost curve and we're going to need uh one more value there that's 10 and that's just the vertical intercept of the marginal cost equation 10 so plugging that 10 in over there so producer Surplus in this area is 12 again base times height so just 80 * 40 so this going to be, 1600 so total producer Surplus is 800 + 1600 or 2400 okay and then last is the dead weight loss the dead weight loss is this triangle right here it's all these units in which consumers have a higher willingness to pay than it cost the monopolis to produce so this triangle region right here is the dead weight loss like all triangles we're going to calculate is 1/2 base time height but we're missing uh some information we need this value right here and again this not drawn very closely to scale but this value is going to occur where price equals marginal cost so 130 -.5 Q = 10 + 2 Q the marginal cost if you were to solve for Q you'd get 48 48 so this value here is 48 12 um base times height so we got 110 minus 90 is 20 multiplied by 48 minus 40 is8 so we got $80 of a dead weight loss and that is how you find consumer surplus prod reducer Surplus and the dead weight loss under Monopoly
Up Next

36:22
Market Failure in Environmental Economics: Causes and Consequences
@ch15swayamprabhaiitmadras77
466 views•2025-01-21

67:20
Globalisation and the 21st Century Enlightenment | Joseph Stiglitz
@EdinburghUniversity
44.8K views•2009-02-10
4:18
How to Calculate the Herfindahl-Hirschman Index (HHI)
@EconomicsinManyLessons
79.5K views•2018-07-23

113:18
The Age of Easy Money: Fed & Inflation | Full Documentary
@frontline
21.2M views•2023-03-15
Related Study Plans & Knowledge Roadmaps
Structured learning paths in Economics
economics
Intellectual Property: Innovation vs Monopoly
01Foundations of Market Power: Monopolies & Deadweight Loss
02The Economic Trade-Off of Intellectual Property
03Patents: R&D Incentives vs. Market Monopolization
+ 3 more learning modules
12h6 modules
Explore Roadmap
economics
Sovereign Debt: Defaults, IMF & Restructuring
01Introduction to Sovereign Debt & Government Bonds
02Debt Sustainability & Credit Ratings
03Anatomy and History of Debt Crises
+ 2 more learning modules
12h5 modules
Explore Roadmap
economics
Market Design: Matching Theory & Gale-Shapley
01Introduction to Market Design and Price-Free Markets
02Two-Sided Matching & The Gale-Shapley Algorithm
03School Choice Systems and Mechanism Design
+ 2 more learning modules
10h5 modules
Explore Roadmap
economics
Impossible Trinity: Forex, Capital & Policy
01Introduction to Monetary Policy and Central Banking
02Exchange Rates and International Capital Flows
03The Mundell-Fleming Model
+ 2 more learning modules
8h5 modules
Explore Roadmap