ML Explainability: Bias, SHAP & LIME
Learning Goal: Audit machine learning models for bias and explain their predictions using interpretability tools like SHAP and LIME.
This curriculum provides a structured, hands-on path from foundational data science concepts to the forefront of Trustworthy AI. You will learn to build classification models, mathematically define and audit them for algorithmic bias, contrast global and local interpretability, and master game-theoretic (SHAP) and local surrogate (LIME) tools to debug and explain black-box models.
- Prerequisites: Basic mathematical intuition (algebra and elementary probability). No prior programming experience is required, as the curriculum starts with a zero-knowledge introduction to Python.
- Estimated Total Study Time: 26 Hours
Module 1: Introduction to Data & Machine Learning
This module establishes your foundation. You will demystify machine learning conceptually, discover why Python has become the lingua franca of data science, and build your initial coding environments to prepare for practical modeling tasks.
Recommended Videos

- Why this video: This video introduces Python's unique capabilities within data science pipelines. It serves as an inspiring launchpad, explaining how Python abstracts complex computations for tasks such as building recommendation engines or modeling financial data.

- Why this video: It bridges the gap between raw data and commercial application. This presentation details the essential Python stack—namely NumPy for numerical structures and Pandas for data manipulation—making it clear why these libraries are fundamental to machine learning.

- Why this video: A roadmap is vital when starting from scratch. This video outlines a clear, step-by-step path for learning Python syntax, control structures (loops and conditionals), and basic data structures (lists, tuples, and dictionaries).
Knowledge Checkpoint
- Understand how supervised machine learning algorithms use structured datasets to map input features to targets.
- Install Python and configure a basic programming environment (such as Jupyter Notebooks).
- Identify the core use cases for the main data science libraries: NumPy (arrays) and Pandas (DataFrames).
- Write basic Python control flows, such as
forloops and conditionalif-elsestatements.
Module 2: Machine Learning Fundamentals & Training
With basic coding established, you will now explore training classification and regression models. You will learn to split datasets, implement models, evaluate performance beyond simple accuracy, and examine why highly accurate models often become non-transparent "black boxes."
Recommended Videos

- Why this video: This deep dive covers building, training, and testing standard classification models in Python. It teaches you how to split your data, run training pipelines, and introduces the limitations of accuracy when dealing with unbalanced datasets.
- Why this video: This lecture covers the essential mathematics of performance metrics. You will learn how to build and interpret a confusion matrix and calculate key metrics such as Precision, Recall, and the F1-Score.

- Why this video: This MIT panel presentation introduces the "black box problem." It outlines how modern models optimize for accuracy by creating highly non-linear, multi-dimensional decision boundaries that are difficult for humans to inspect or understand.
Knowledge Checkpoint
- Explain why a simple accuracy score can be a misleading metric when evaluating models on imbalanced datasets.
- Construct a confusion matrix and calculate Precision () and Recall () by hand.
- Differentiate between training, validation, and test datasets, and explain the risk of data leakage.
- Define the "black box problem" and explain why model complexity often conflicts with human interpretability.
Module 3: Algorithmic Bias and Fairness in AI
Machine learning models do not operate in a vacuum; they inherit and amplify real-world societal biases. In this module, you will learn how bias creeps into datasets, analyze key fairness failures, and study quantitative metrics to audit and mitigate these issues using Python libraries.
Recommended Videos

- Why this video: This trailer for the Coded Bias documentary illustrates the societal impact of algorithmic bias. It highlights how facial recognition systems can fail when trained on non-representative datasets, showing the human consequences of un-audited AI systems.
- Why this video: This video bridges the gap between ethics and mathematics. It clearly defines three key quantitative fairness metrics: Demographic Parity, Equal Opportunity, and Equalized Odds, explaining how to calculate them using model outcomes and protected attributes.

- Why this video: This comprehensive coding workshop provides hands-on practice with algorithmic fairness. It shows how to use the open-source Fairlearn library in Python to audit a classification model, calculate group metrics, and apply mitigation algorithms to reduce disparate impact.
- Why this video: This case study highlights the importance of open-source audit toolkits (such as Aequitas). It explains how to structure an audit by selecting protected attributes and choosing appropriate fairness criteria based on your project's real-world impact.
Knowledge Checkpoint
- Explain how historical and selection biases in raw training data can lead to biased model predictions.
- Define Demographic Parity and explain how it differs from Equal Opportunity (matching True Positive Rates across groups).
- Use the Fairlearn library in Python to generate a demographic performance disparity report.
- Calculate the Disparate Impact Ratio and apply the "four-fifths rule" () to test for adverse impacts against a protected group.
Module 4: Introduction to Explainable AI (XAI)
Explainable AI (XAI) helps bridge the gap between high accuracy and human trust. In this module, you will study the fundamental tradeoff between model complexity and interpretability, compare models that are transparent by design with post-hoc explainers, and learn the differences between global and local interpretability.
Recommended Videos

- Why this video: This introduction highlights the growing need for explainability as models become more complex. It provides a clear overview of why trust, regulatory compliance, and system debugging require interpretable systems.

- Why this video: This video directly addresses the distinction between Global Interpretability (explaining the overall logic of a model across all predictions) and Local Interpretability (explaining the specific reason behind a single prediction).

- Why this video: This Stanford seminar explains inherently interpretable models. You will learn about models that are transparent by design, such as shallow decision trees and generalized additive models, and study their benefits and limitations compared to black-box models.

- Why this video: This seminar focuses on post-hoc explanation methods, which are used to explain complex, pre-trained models. It establishes the theoretical foundation for model-agnostic local surrogate models and feature attribution methods.
Knowledge Checkpoint
- Describe the inverse relationship between a model's prediction accuracy and its inherent explainability.
- Contrast inherently interpretable models (like linear regression and shallow decision trees) with black-box models (like deep neural networks).
- Differentiate between Global Interpretability and Local Interpretability, providing a practical use case for each.
- Define the term "Model-Agnostic Post-Hoc Explainer" and explain why model-agnostic tools are highly adaptable.
Module 5: Interpreting Models with SHAP and LIME
In this final module, you will master the two most popular model-agnostic interpretability tools: SHAP (Shapley Additive exPlanations) and LIME (Local Interpretable Model-agnostic Explanations). You will study the mathematics of Shapley values, understand local linear surrogates, and implement both tools in Python.
Recommended Videos
- Why this video: This video explains how cooperative game theory applies to machine learning. It walks through how to calculate a feature's marginal contribution across all possible feature combinations, ensuring a fair distribution of the prediction's "payoff."

- Why this video: This video provides an intuitive visual and mathematical breakdown of LIME. It explains how LIME perturbs data points around a target prediction, runs them through the black-box model, and trains a simple, interpretable linear surrogate model on those weighted perturbations.
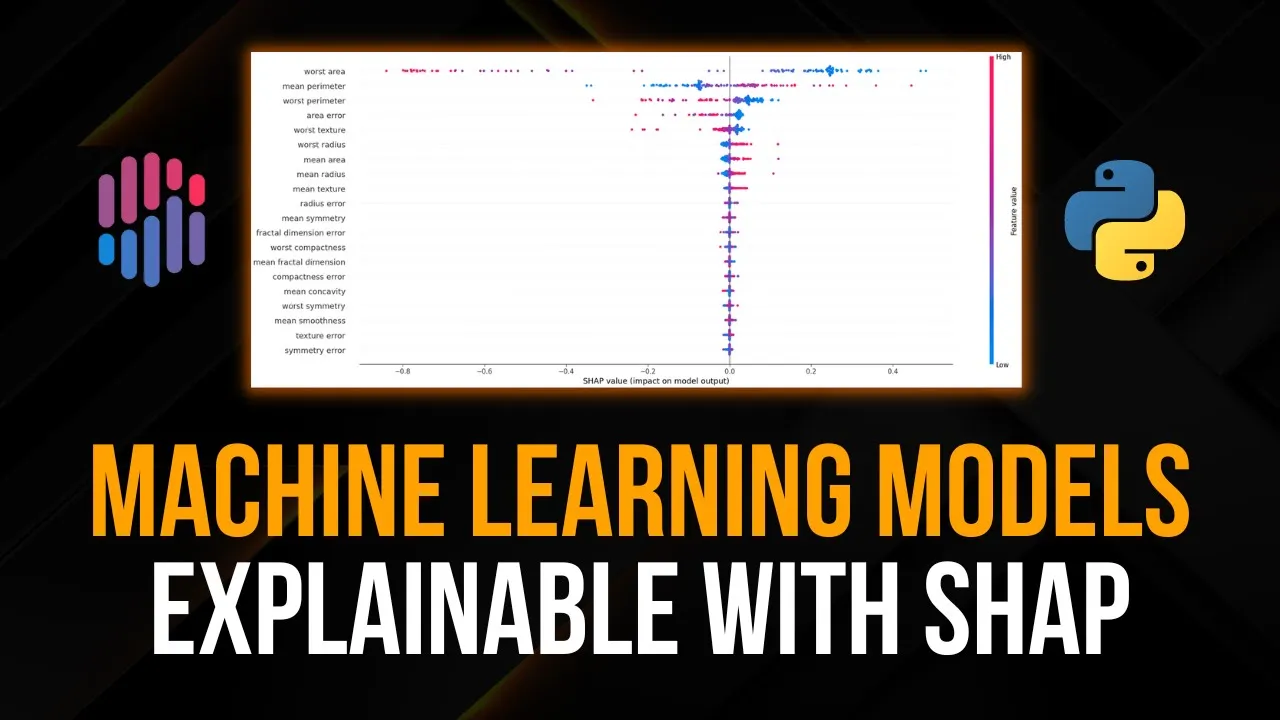
- Why this video: This hands-on Python tutorial shows how to implement the
shaplibrary. You will learn how to initialize an explainer, calculate SHAP values for your test data, and interpret both local force plots and global summary plots.
- Why this video: This PyData workshop offers an in-depth comparison of SHAP and LIME. It walks through practical code implementations, highlighting the strengths and limitations of each method and demonstrating how to use them to debug real-world classification models.
Knowledge Checkpoint
- Explain how game-theoretic Shapley values guarantee a fair distribution of feature contributions.
- Describe the step-by-step process of how LIME creates a local surrogate model around a single prediction.
- Code a SHAP analysis in Python, outputting both a Force Plot (for local explanation) and a Beeswarm Summary Plot (for global explanation).
- Compare LIME and SHAP across key criteria: consistency, mathematical rigor, computation time, and ease of use.
Course Map
This flowchart shows the recommended learning path and dependencies across the five modules:
Key People Index
The following researchers and educators have helped shape the fields of machine learning, algorithmic fairness, and model interpretability:
- Dr. Joy Buolamwini: Founder of the Algorithmic Justice League and a central figure in the Coded Bias documentary. Her research at MIT uncovered significant racial and gender bias in commercial facial analysis algorithms.
- Dr. Rayid Ghani: Professor at Carnegie Mellon University and former Chief Scientist for the 2012 Obama campaign. He is a leading advocate for using data science for social good and helped develop open-source bias auditing frameworks.
- Lloyd Shapley (1923–2016): An American mathematician and Nobel laureate in Economics. He developed the Shapley value in cooperative game theory, which now serves as the mathematical foundation for the SHAP framework.
- Dr. Cynthia Rudin: Professor of Computer Science at Duke University and a prominent researcher in interpretable machine learning. She advocates for using inherently interpretable models over post-hoc explanations for high-stakes decisions.
- Kevin Lemagnen: Data scientist and open-source contributor who has developed extensive practical tutorials and workshops on implementing LIME and SHAP in industry pipelines.
Final Self-Assessment
Test your understanding of the concepts covered in this curriculum with this final checklist:
- Explain the difference between supervised and unsupervised machine learning.
- Calculate Precision, Recall, and F1-Score from a confusion matrix.
- Explain how a highly accurate model can still exhibit disparate impact against a protected group.
- Calculate the Disparate Impact Ratio and apply the "four-fifths rule" to test for adverse impacts.
- Explain why a model's complexity can make it a "black box," and outline the risks of deploying such models in high-stakes fields like healthcare or finance.
- Contrast inherently interpretable models with post-hoc explanation methods, providing examples of each.
- Contrast global interpretability (understanding overall model behavior) with local interpretability (explaining a single prediction).
- Explain how Shapley values use game theory to fairly attribute a model's prediction to its individual features.
- Describe how LIME creates local linear models to approximate and explain complex non-linear models.
- Implement code in Python using the
shaplibrary to generate a global beeswarm plot and explain its feature impact directions. - Implement code in Python using the
fairlearnlibrary to audit and mitigate bias in a classification model.