Water Filtration: DIY Gravity System & Sensors
Learning Goal: Design and construct a multi-stage gravity-fed water filtration system, analyzing purification efficiency using TDS, pH, and turbidity sensors.
- Estimated Hours: 16 hours
- Prerequisites: Basic knowledge of electrical circuits (voltage, current, resistance), familiarity with algebraic equations, and comfort working with hand tools (drills, utility knives).
Module 1: Introduction to Water Contaminants & Filtration Physics
This module establishes the scientific foundation of water purification. You will examine the physics and chemistry behind physical barriers, adsorption dynamics using activated carbon, and the mechanics of slow sand filters. Understanding these core processes is critical before designing physical layers in later stages.
Recommended Videos

Why this video: This academic lecture details the hydraulic and physical mechanisms of slow sand filtration. It explains the biological and mechanical processes (such as sedimentation, straining, and biological action) that occur within the sand layers to remove up to 99% of impurities.
- Knowledge Checkpoint:
- Understand the differences between straining, sedimentation, and adsorption within porous media.
- Identify the typical hydraulic loading rates of slow sand filters.
- Explain how a biological layer (schmutzdecke) develops and helps trap pathogens.

Why this video: Dr. Huberman clarifies the division of labor in filtration: physical (mechanical) barriers vs. chemical adsorption. This distinction is vital when structuring the physical hierarchy of your filtration column.
- Knowledge Checkpoint:
- Differentiate between mechanical pore size filtration and chemical adsorption.
- Define the primary contaminants addressed by mechanical filtration versus chemical filtration.
- Explain why single-mechanism filters are insufficient for comprehensive water purification.

Why this video: This video introduces the structural properties of activated carbon, illustrating how its immense surface area acts as a porous sponge to trap chemical compounds via surface-level adsorption.
- Knowledge Checkpoint:
- Explain how carbon is "activated" to increase its internal surface area.
- Define adsorption (surface adhesion) and differentiate it from absorption.
- Identify which chemical impurities (e.g., chlorine, volatile organic compounds) are effectively captured by activated carbon.
Module 2: Designing and Building the Multi-Stage Gravity Filter
Translate theoretical physics into a physical filtration column. This module guides you through selecting materials, cleaning media, and arranging physical filtration layers sequentially to maximize gravity-fed throughput and particulate capture.
   [Raw Influent Water]
             │
             ▼
  ┌──────────────────────┐
  │ Layer 1: Gravel      │ <── Coarse sediment capture
  ├──────────────────────┤
  │ Layer 2: Fine Sand   │ <── Micro-particle straining
  ├──────────────────────┤
  │ Layer 3: Charcoal    │ <── Chemical adsorption (odor/toxins)
  ├──────────────────────┤
  │ Layer 4: Cloth/Mesh  │ <── Media retention barrier
  └──────────────────────┘
             │
             ▼
  [Filtered Effluent Water]
Recommended Videos

Why this video: This survival tutorial demonstrates the critical sequence of layers within a field-expedient gravity filter. It provides practical context on why specific materials are packed in a precise top-to-bottom sequence.
- Knowledge Checkpoint:
- Explain why water must travel from the coarsest material (gravel) to the finest material (sand/charcoal) in a standard gravity filter.
- Identify the function of the bottom-most cloth barrier.
- Describe the consequence of packing sand layers out of order.

Why this video: A comprehensive, step-by-step practical guide to constructing a durable multi-container gravity filtration system. It focuses on preparation, drilling, physical seals, and the logistics of setting up double-bucket designs.
- Knowledge Checkpoint:
- Select appropriate plastic container materials (such as food-grade HDPE buckets).
- Demonstrate how to seal connection points and bulkheads to prevent water bypass.
- Estimate flow rates based on gravity column height.

Why this video: This video explores the integration of highly uniform commercial filtration media (such as ceramic elements containing carbon) inside a dual-bucket gravity system, establishing baseline standards for safe construction.
- Knowledge Checkpoint:
- Compare raw loose-media columns to solid porous ceramic filtration blocks.
- Execute proper washing protocols for media before final assembly.
- Identify structural failure points (such as stress fractures around bucket penetrations).
Module 3: Microcontrollers & Water Quality Sensors
This module transitions from physical construction to digital telemetry. You will learn the fundamentals of the Arduino platform, configure basic analog-to-digital reading paths, and interface raw physical analog probes (pH, TDS, and Turbidity) with microcontroller pins.
Recommended Videos

Why this video: Paul McWhorter provides a clear introduction to Arduino microcontrollers, physical layout, pin distributions, and working environments.
- Knowledge Checkpoint:
- Locate Digital, Analog, 5V, 3.3V, and Ground (GND) pins on an Arduino board.
- Describe the process of loading code (Sketches) onto the microcontroller.
- Understand how electrical ground completes a measurement loop.

Why this video: This tutorial demonstrates how to read continuously variable analog voltage values (representing sensor states) and transmit those readings to a computer screen via the Serial Monitor.
- Knowledge Checkpoint:
- Explain the operation of a 10-bit Analog-to-Digital Converter (ADC).
- Map the raw ADC output range (0 to 1023) to input voltages (0 to 5V).
- Write a basic Arduino sketch utilizing the
analogRead()andSerial.println()functions.
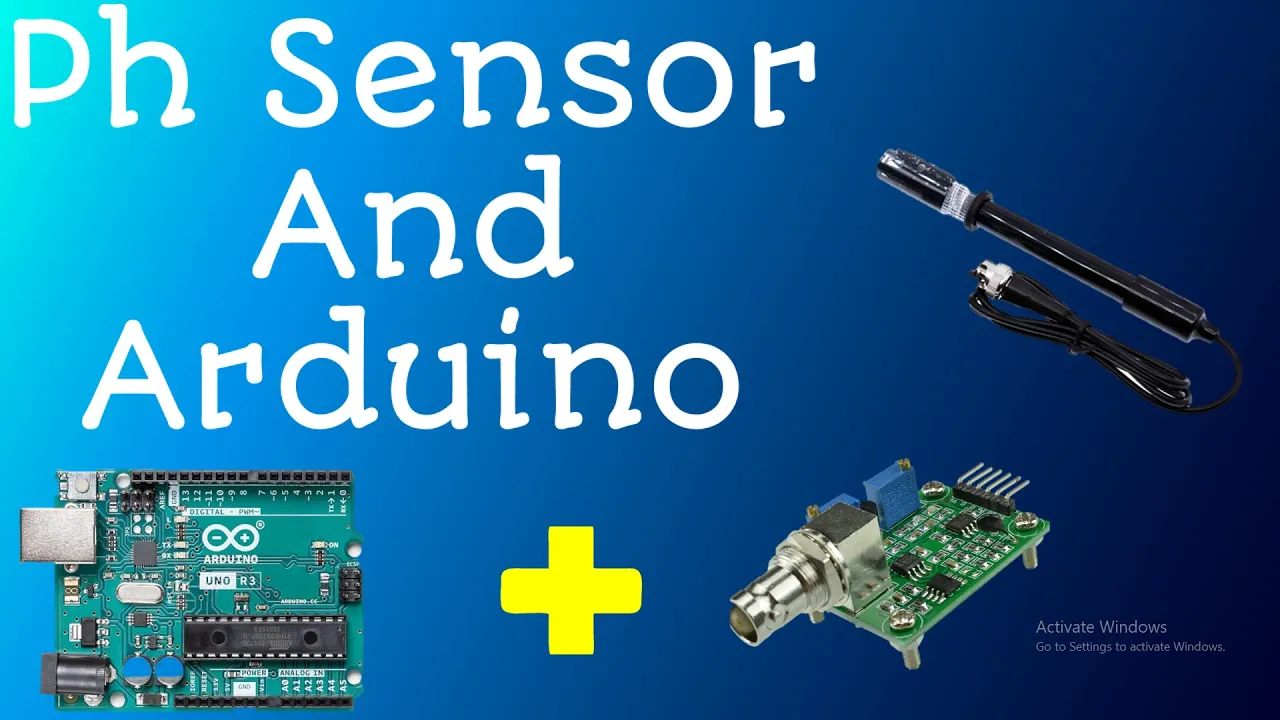
Why this video: This video details how an analog pH probe operates. It covers the structural makeup of the glass bulb and outlines the physical electrical path to the signal conditioning board, as well as the initial connections to Arduino.
- Knowledge Checkpoint:
- Identify the purpose of the pH signal conditioning board (voltage conversion and offset shift).
- Wire the pH module's power, ground, and analog output pins to the Arduino.
- Understand why glass-bulb pH sensors require careful handling and wet storage.
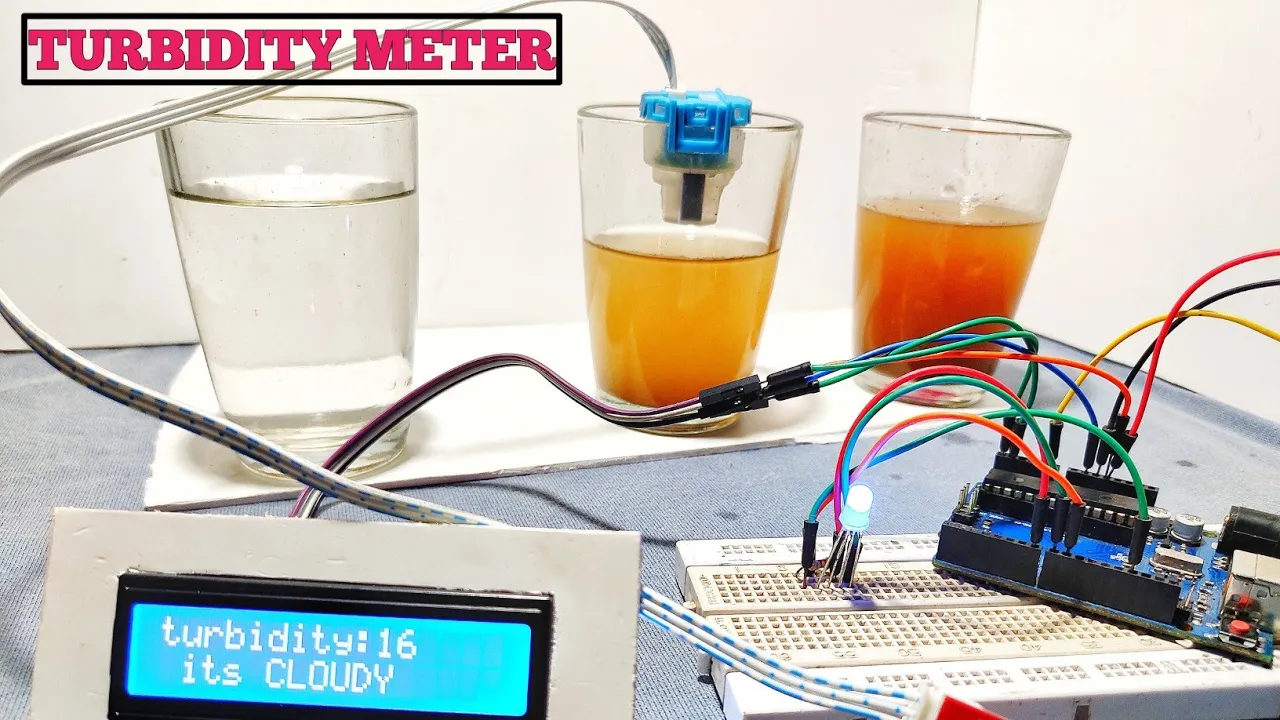
Why this video: This video demonstrates how to set up an analog optical turbidity sensor, which measures particulate matter suspended in water by detecting scattered light.
- Knowledge Checkpoint:
- Wire the turbidity sensor's signal conditioning board to the Arduino's analog input pin.
- Describe how light scattering changes the output voltage of the phototransistor.
- Identify the hardware switch modes (analog output vs. digital trigger output) on the driver board.
Module 4: Sensor Calibration & Programming
Raw analog values (0–1023) are meaningless without calibration. This module covers the mathematical principles and practical programming steps required to convert voltage values into engineering units: Standard pH, Nephelometric Turbidity Units (NTU), and Parts Per Million (PPM) of TDS.
Recommended Videos

Why this video: This tutorial teaches you how to convert raw ADC step numbers into actual physical voltage values using basic arithmetic operations in C/C++.
- Knowledge Checkpoint:
- Implement the voltage conversion formula: .
- Understand why selecting floating-point data types (
float) is critical for accurate calculations. - Explain the impact of a fluctuating supply voltage reference on measurement accuracy.
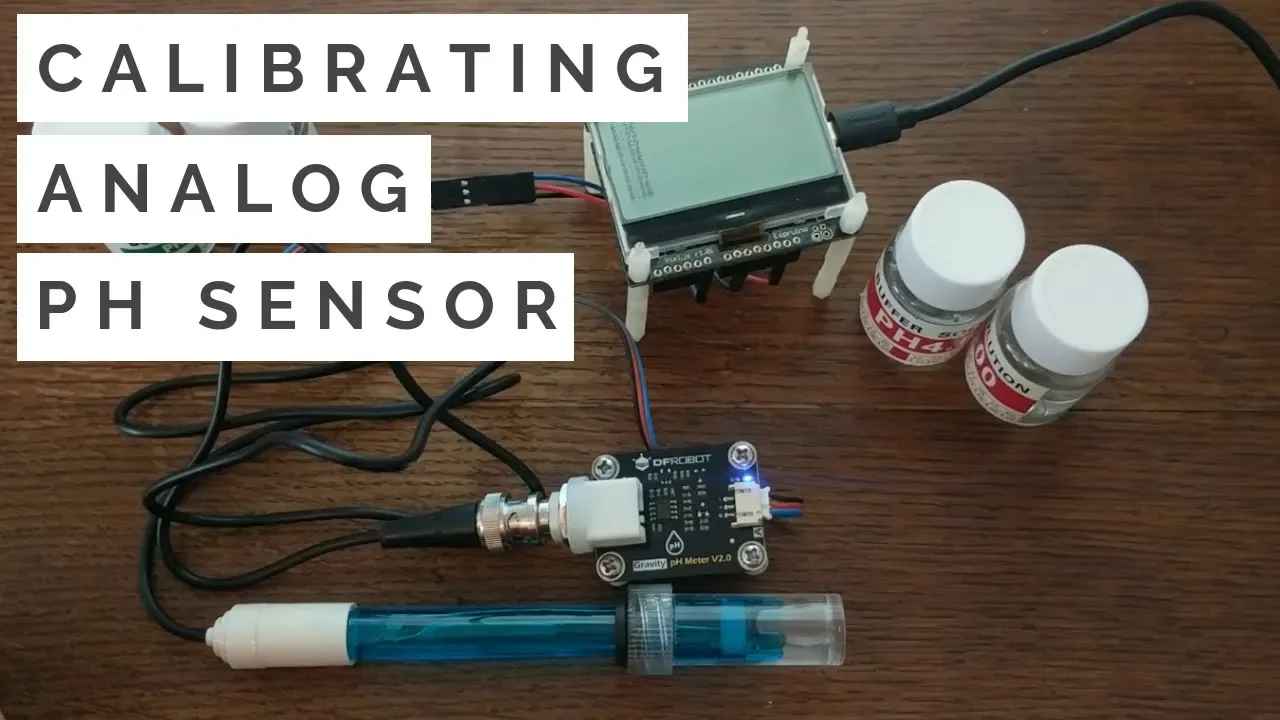
Why this video: This concise video details how to map raw readings to a linear calibration curve () using standard buffer solutions to calculate the exact slope and offset for pH.
- Knowledge Checkpoint:
- Explain why a two-point calibration using standard buffer solutions (e.g., pH 4.0 and pH 7.0) is necessary.
- Calculate the linear equation coefficients ( = slope, = intercept) from your calibration data.
- Write the Arduino code block to output corrected pH readings.
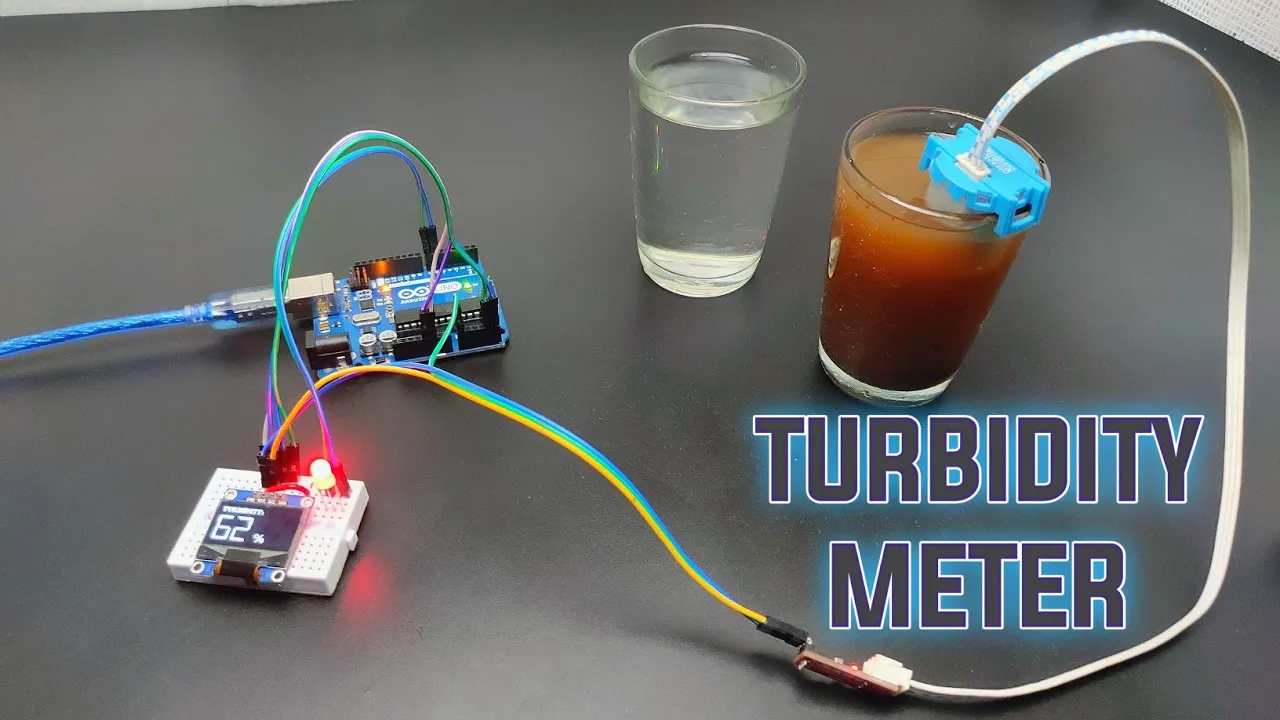
Why this video: This step-by-step tutorial demonstrates how to map turbidity voltage values to corresponding NTU values. It highlights the importance of reading zero-turbidity baseline values in clean distilled water.
- Knowledge Checkpoint:
- Establish the zero-turbidity reference voltage value in distilled water.
- Describe the inverse relationship between water turbidity and output voltage.
- Understand why high turbidity causes the sensor's voltage output to drop.
Calibration Math & Coding (Addressing Video Gaps)
Important Note on Video Limitations: While basic analog reads are well documented in standard videos, the actual non-linear physics of turbidity and the temperature-dependent electrical conductivity of TDS are rarely fully explained in single tutorials. Below is the complete mathematical and programming framework you must implement.
1. Turbidity Non-Linear Curve Calibration (Voltage to NTU)
Unlike standard linear sensors, light scattering in water is highly non-linear. Standard gravity-based turbidity sensors (such as the TS-300B) use a parabolic regression model to convert voltage () into NTU (Nephelometric Turbidity Units).
When voltage () is less than , the turbidity is considered too high to measure accurately. When , the liquid is essentially clear ().
The standard regression model is:
Example Arduino Code Implementation:
const int turbidityPin = A1;
float readTurbidity() { int rawADC = analogRead(turbidityPin); // Convert 10-bit ADC to voltage float voltage = rawADC * (5.0 / 1023.0);
float ntu = 0.0; if (voltage >= 4.2) { ntu = 0.0; // Clear water threshold } else if (voltage < 2.5) { ntu = 3000.0; // Max limit of detection } else { // Parabolic regression curve conversion ntu = -1120.4 * sq(voltage) + 5742.3 * voltage - 4353.8; } return ntu; }
2. Total Dissolved Solids (TDS) Calibration Math
TDS sensors measure electrical conductivity (). Dissolved salts conduct electricity, and their concentration in parts per million () is proportional to the value.
However, water temperature () dramatically affects conductivity (increasing by roughly per ). To get accurate readings, we must normalize the conductivity to a reference baseline.
Temperature Compensation Formula:
Voltage-to-TDS Conversion Math:
Where is the temperature-compensated voltage value.
Example Arduino Code Implementation:
const int tdsPin = A2; const float temperature = 25.0; // Use a constant or read a DS18B20 temp sensor
float readTDS() { int rawADC = analogRead(tdsPin); float rawVoltage = rawADC * (5.0 / 1023.0);
// Apply temperature compensation factor float compCoefficient = 1.0 + 0.02 * (temperature - 25.0); float compVoltage = rawVoltage / compCoefficient;
// Convert compensated voltage to TDS in PPM float tdsValue = (133.42 * pow(compVoltage, 3) - 255.86 * sq(compVoltage) + 857.39 * compVoltage) * 0.5; return tdsValue; }
Module 5: Testing, Data Logging, and Efficiency Analysis
This final module synthesizes physical construction and electronic sensing. You will run contaminated water mixtures through your physical filter column, record real-time telemetry from all three sensors, write that data to an SD card, and calculate the overall purification efficiency of your system.
Recommended Videos
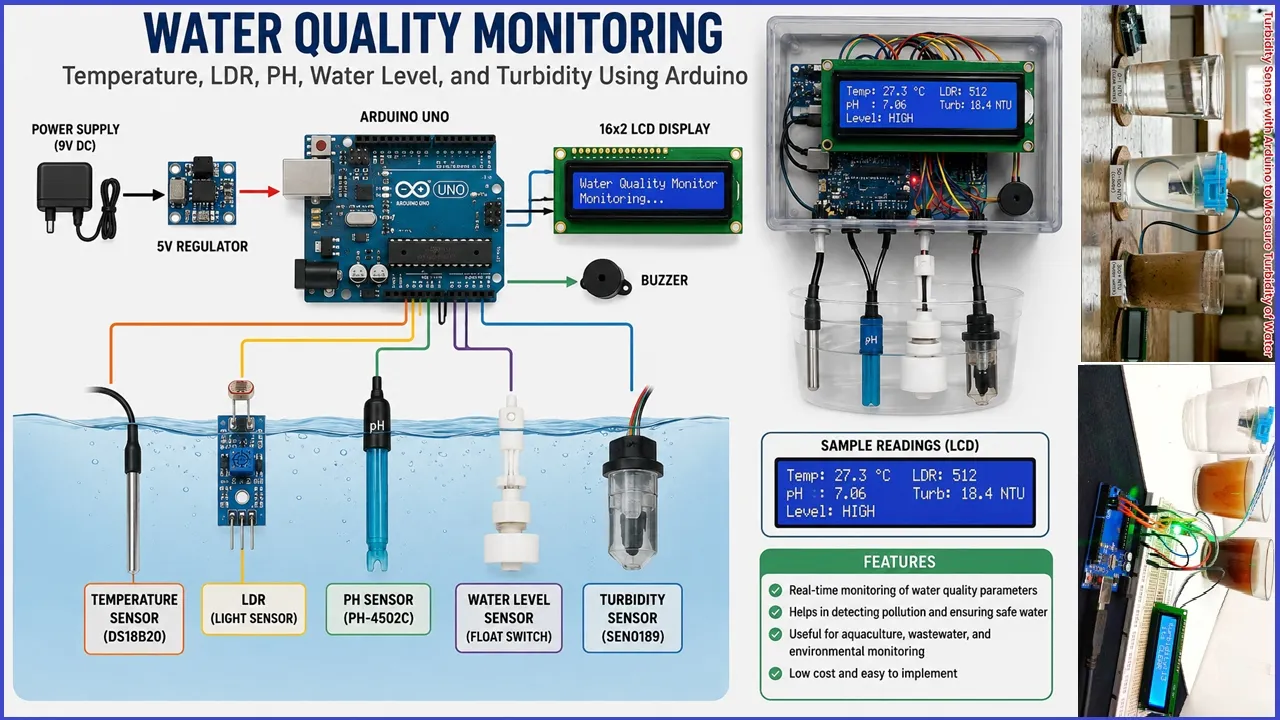
Why this video: This video demonstrates how to run multiple sensors (pH, turbidity, etc.) simultaneously on a single Arduino board, addressing the challenge of multi-sensor hardware integration.
- Knowledge Checkpoint:
- Construct a unified wiring schematic with multiple sensors powered by the same board.
- Identify and resolve electrical noise issues that can occur when several sensors are submerged in the same liquid.
- Structure your program to output all sensor data cleanly in a single serial transmission.

Why this video: A comprehensive tutorial on interfacing SD card reader breakout boards using SPI communication to save and store sensor readings over long testing cycles.
- Knowledge Checkpoint:
- Wire an SD Card Shield/Breakout using standard SPI pins (MISO, MOSI, SCK, CS).
- Write values to a
.csv(Comma-Separated Values) format file on the SD card using the<SD.h>library. - Safely open and close files in code to prevent data corruption.

Why this video: This video explains how to properly test a filter's performance by comparing unfiltered inlet water against the filtered outlet water from the same batch.
- Knowledge Checkpoint:
- Define the steps to take representative "before" and "after" water samples.
- Explain why testing input and output water from the same batch is critical to avoid false readings.
- Identify how external variables (such as water pressure or run-time) can affect filtration efficiency.
Purification Efficiency & Performance Analysis (Addressing Video Gaps)
                   [RAW INFLUENT WATER]
                Measure: TDS_in, Turb_in, pH_in
                           │
                           ▼
                ┌──────────────────────┐
                │                      │
                │   Gravity-Fed Filter │
                │                      │
                └──────────────────────┘
                           │
                           ▼
                  [FILTERED EFFLUENT]
                Measure: TDS_out, Turb_out, pH_out
To mathematically calculate the performance of your custom gravity-fed filtration system, implement the following formulas when processing your sensor logs.
1. Particulate and Solid Removal Efficiency (%)
Removal efficiency measures how effectively your physical sand, gravel, and charcoal layers trap suspended and dissolved solids. Calculate this efficiency value for both Turbidity (NTU) and TDS (PPM):
Where:
- = Raw influent concentration value (Turbidity or TDS)
- = Filtered effluent concentration value (Turbidity or TDS)
Example:
- Influent Turbidity () =
- Effluent Turbidity () =
2. pH Neutralization Index (pH Target Deviation Reduction)
Unlike physical solids, pH is measured on a logarithmic scale, and the goal of a water filter is typically to bring the water closer to a neutral pH of 7.0. We calculate how effectively our system neutralizes acidic or basic influent water using this deviation formula:
Where:
- = Influent pH value
- = Effluent pH value
Example:
- Influent acidic runoff () =
- Effluent after running through activated carbon and sand () =
3. Analyzing Data Logs
Once you have written your data to an SD card in CSV format, import the file into a spreadsheet tool (like Microsoft Excel, Google Sheets, or a Python script) to plot performance over time. This analysis will help you spot when physical layers are wearing down or starting to clog:
Timestamp(ms),TDS_In(PPM),TDS_Out(PPM),Turb_In(NTU),Turb_Out(NTU),pH_In,pH_Out,TDS_Eff(%),Turb_Eff(%) 10000,120.5,12.2,450.0,12.5,5.2,6.8,89.87,97.22 20000,120.5,12.4,450.0,12.8,5.2,6.8,89.70,97.15 30000,120.2,14.5,450.0,15.2,5.2,6.7,87.93,96.62
A sudden drop in your calculated efficiency scores indicates channeling (where water cuts direct pathways through media without filtering) or media exhaustion (where your activated carbon layers can no longer absorb contaminants).
Course Map
Below is the recommended sequence for your study. Ensure all prerequisites are completed before starting physical construction and programming modules.
Key People Index
- Dr. Andrew Huberman (Stanford University School of Medicine)
- Context: Discusses research-backed health perspectives on tap water quality, mechanical filtration processes, and chemical adsorption methods.
- Paul McWhorter (D'Arbonne Analytical Laboratories)
- Context: Created fundamental open-source educational videos for Arduino and electronics prototyping.
Final Self-Assessment
Complete this final checklist before concluding the project:
- Explain the physical differences between mechanical straining in sand and chemical adsorption in activated carbon.
- List the correct top-to-bottom layering sequence for a multi-stage gravity filtration column (gravel fine sand activated carbon mesh/cloth).
- Connect the analog pH, TDS, and turbidity sensor boards to an Arduino microcontroller without causing electrical short circuits.
- Explain the operation of a 10-bit Analog-to-Digital Converter (ADC) and how to convert step readings into analog voltages.
- Implement a two-point linear calibration model () for an analog pH sensor using standard buffer solutions.
- Apply a non-linear quadratic regression equation to convert turbidity sensor output voltage into NTU.
- Write temperature compensation routines in C++ to correct raw TDS voltage readings back to a standard reference.
- Write clean data logs in CSV format to an external SD card via SPI communication.
- Calculate the removal efficiency () of a filter system using the standard inlet/outlet equation for TDS and turbidity.
- Calculate the neutralization index () of your filter system using deviation metrics for pH.
- Identify physical filter failure points (such as channeling or media exhaustion) by interpreting changes in your plotted sensor data.