Mastering 12-Lead ECG Interpretation: From Basic Electrophysiology to Complex Arrhythmia Diagnosis
Learning Goal: Build a comprehensive, clinical-grade mastery of electrocardiogram (ECG) interpretation. This curriculum takes you from the foundational physics of cardiac cellular electrophysiology up to highly systematic, emergency-level diagnostic protocols for complex arrhythmias, myocardial infarctions, bundle branch blocks, and chamber hypertrophies.
- Prerequisites: Basic understanding of human biology (circulatory system basics). No prior cardiology knowledge required.
- Estimated Study Time: 15 hours (including video lectures, interactive self-assessments, and clinical tracing practices).
Module 1: Cardiac Anatomy and Electrophysiology
This module bridges the gap between gross anatomy and cellular electrophysiology. You will study how the blood flows through the heart chambers, how the cardiac conduction pathway coordinates mechanical contraction, and how ions moving across the myocyte membrane generate the action potentials recorded by an ECG.
Recommended Videos
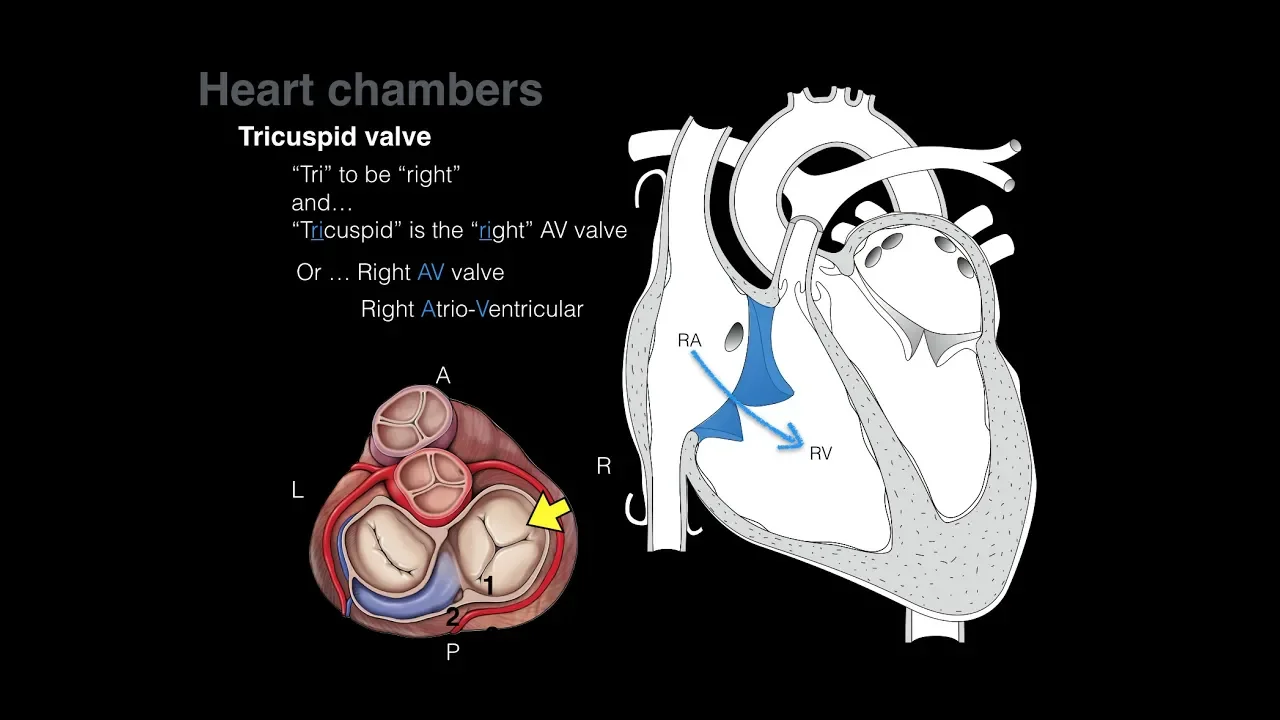
Why this video: A complete, visually rich breakdown of cardiac anatomy. To interpret where electrical vectors travel, you must first master the physical orientation of the four chambers, the major blood vessels, and the valvular structures of the heart.
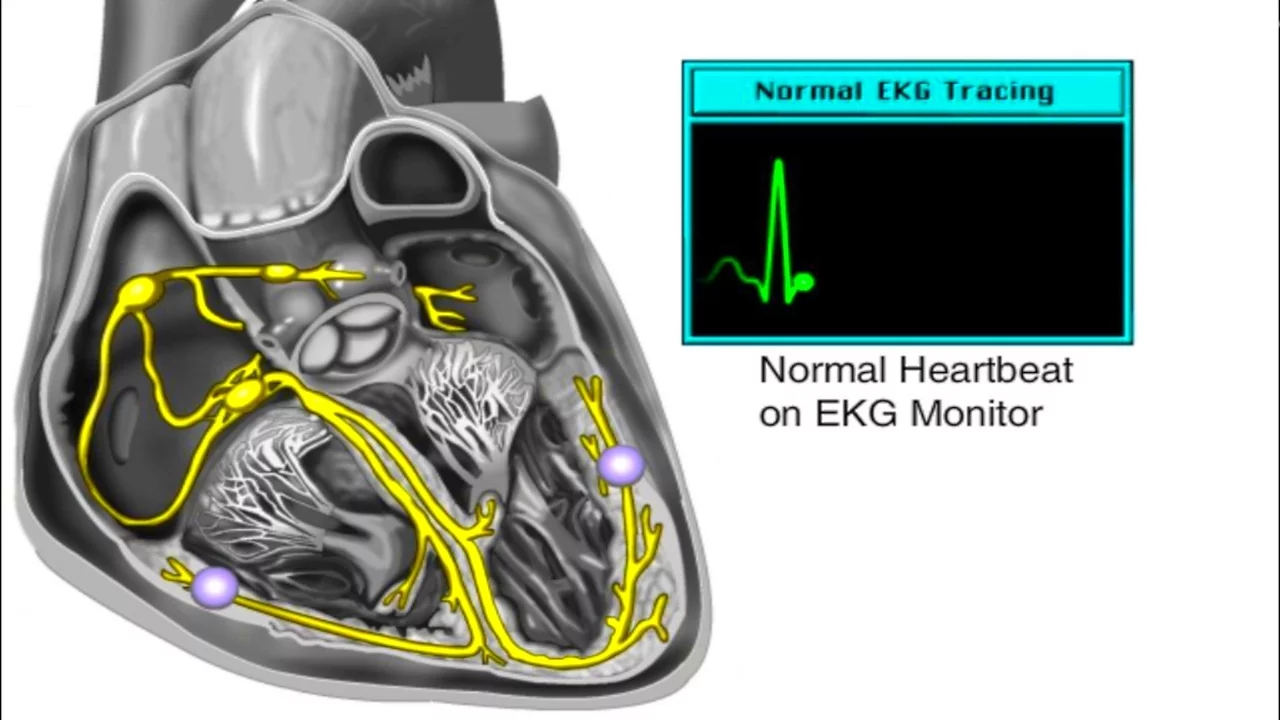
Why this video: This video uses animation to show how electrical impulses propagate from the sinoatrial (SA) node down to the Purkinje fibers. It bridges mechanical contractions (systole and diastole) with their corresponding electrical triggers.

Why this video: This high-yield video provides a concise breakdown of the five phases of the non-nodal cardiac action potential. It explains the mechanics of cellular polarization: Phase 0 ( influx), Phase 1 (early efflux), Phase 2 ( influx plateau), Phase 3 ( efflux repolarization), and Phase 4 (resting membrane potential), addressing a key foundational concept in electrophysiology.
Module 1 Knowledge Checkpoint
- Trace the path of a drop of blood through the cardiac chambers, valves, and pulmonary/systemic circuits.
- Map the chronological pathway of electrical excitation through the heart starting at the SA node and ending at the Purkinje network.
- Explain the ion currents responsible for Phase 0 (depolarization) and Phase 2 (plateau phase) of the ventricular action potential.
- Connect the physiological delay at the AV node to its mechanical purpose (atrial kick / ventricular filling).
Module 2: ECG Fundamentals: Waves, Intervals, and the Grid
This module introduces how electrical potentials are projected onto standardized ECG grid paper. You will learn the exact duration and amplitude parameters of the P-QRS-T sequence and study the mathematical rules required to calculate heart rates under both regular and irregular rhythm conditions.
Recommended Videos
Why this video: An industry-standard introduction to basic ECG vectors. This lecture explains how the deflection direction (positive vs. negative waves) is physically determined by the direction of the electrical depolarization wavefront relative to the recording electrode.

Why this video: A precise, grid-focused tutorial demonstrating how time and voltage are structured on standard ECG paper (where horizontally, and ). It introduces the math behind the "300 rule" and the "1500 rule" for calculating rates.
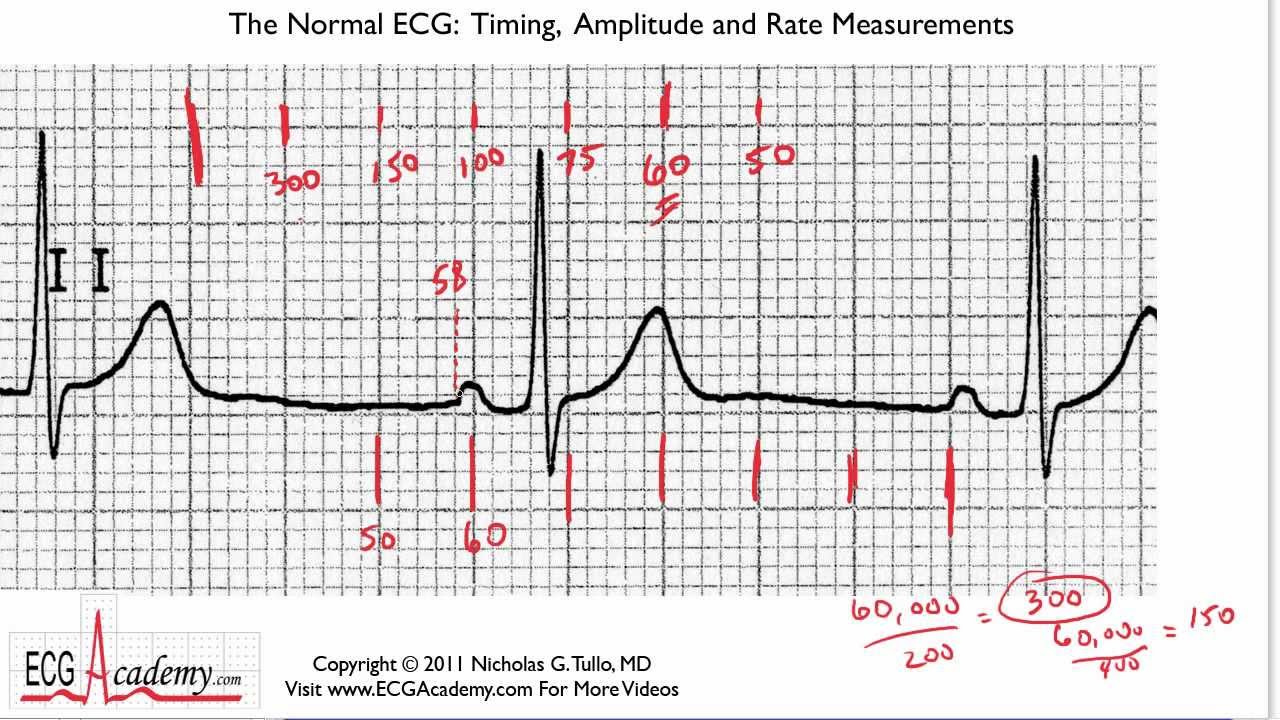
Why this video: This lecture addresses a key gap in standard curricula by walking through the mathematical foundations of calculating heart rate. It shows how the formula serves as the foundation for clinical short-cuts, such as the 300, 1500, and 6-second rules.
Module 2 Knowledge Checkpoint
- Memorize the grid paper values: 1 small box = 0.04s (1mm), 1 large box = 0.20s (5mm), 5 large boxes = 1.00s.
- State the normal physiological durations of the PR interval (120–200 ms) and the QRS complex (<120 ms).
- Calculate the ventricular rate of a regular ECG strip using the 300 and 1500 rules.
- Correctly apply the 6-second strip method (counting R-waves and multiplying by 10) to determine rate during irregular rhythms like Atrial Fibrillation.
Module 3: The 12-Lead System and Electrical Axis
This module explores the spatial geometry of the 12-lead ECG. You will learn precise anatomical landmarks for lead placement and study how the frontal (limb leads) and horizontal (precordial leads) planes capture three-dimensional electrical pathways, concluding with cardiac axis determination.
Recommended Videos
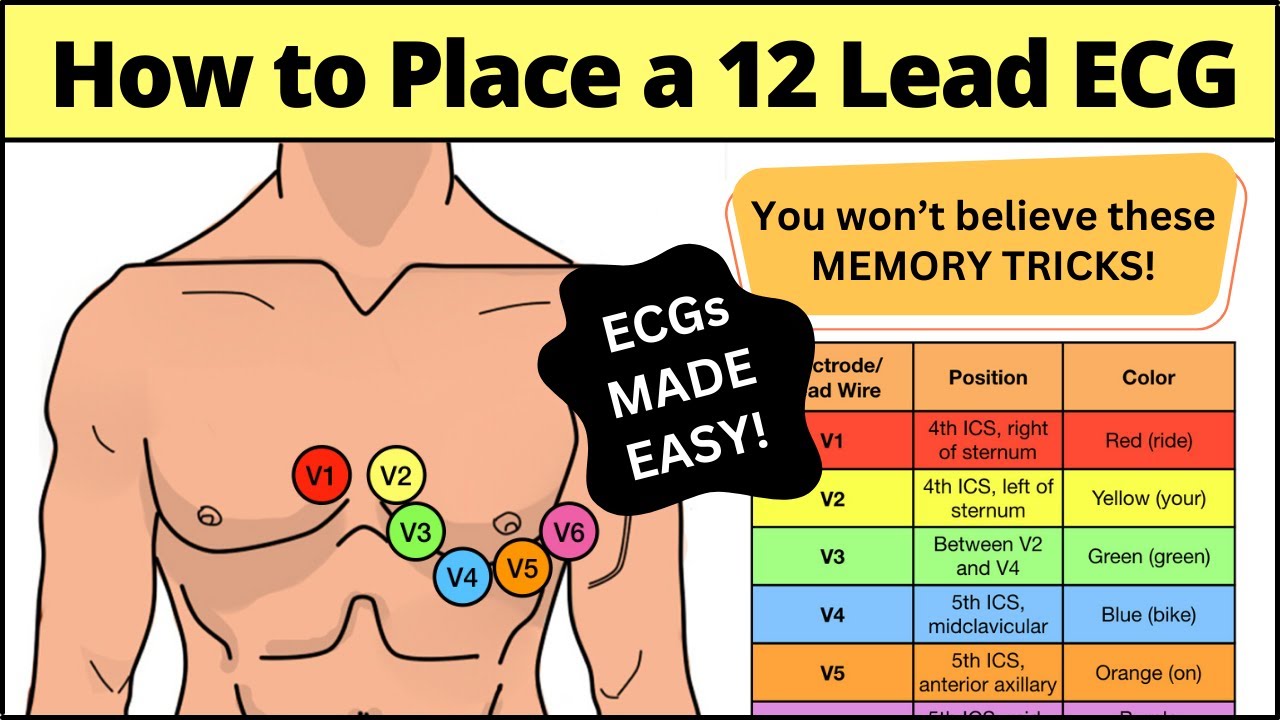
Why this video: A clear, clinical guide to standard electrode positioning. This video provides step-by-step instructions for placement, including finding the Angle of Louis, locating the 4th/5th intercostal spaces for precordial leads V1–V6, and preventing common errors in limb lead placement.

Why this video: An intuitive, structured approach to analyzing a complete 12-lead layout. It clarifies how standard bipolar (I, II, III), augmented unipolar (aVR, aVL, aVF), and chest precordial leads (V1–V6) assemble a multi-dimensional perspective of the electrical axis.

Why this video: A deep dive into vector physics via the hexaxial reference system. It explains how to determine the exact cardiac axis deviation (Normal, Left, Right, or Extreme/Indeterminate) in the frontal plane by examining the net polarity of leads I, II, and aVF.
Module 3 Knowledge Checkpoint
- Identify the exact placement locations of the V1–V6 electrodes on a patient's chest wall.
- Distinguish between bipolar leads (I, II, III) and augmented unipolar limb leads (aVR, aVL, aVF) based on their anatomical poles.
- Determine a patient's cardiac axis deviation in under 10 seconds using the "two-thumb" or "three-lead" method (examining QRS polarity in Leads I, II, and aVF).
- Describe the physiological and pathological causes of Left Axis Deviation (LAD) and Right Axis Deviation (RAD).
Module 4: Arrhythmias and Conduction Blocks
This module examines abnormal electrical pathways. You will learn to diagnose various cardiac rhythms, distinguish between benign and life-threatening atrioventricular (AV) blocks, and contrast chaotic supraventricular tachycardias with unstable ventricular rhythms.
Recommended Videos
Why this video: This video provides a comprehensive review of AV conduction delays. It covers First-degree, Second-degree (Mobitz Type I Wenckebach vs. Mobitz Type II), and Third-degree (complete) heart blocks, highlighting the clinical significance and typical ECG findings for each.

Why this video: This guide breaks down the distinction between atrial fibrillation and atrial flutter. It teaches a five-step analysis to help you differentiate chaotic, irregular, non-p-wave fibrillatory patterns from organized, sawtooth flutter wave patterns.
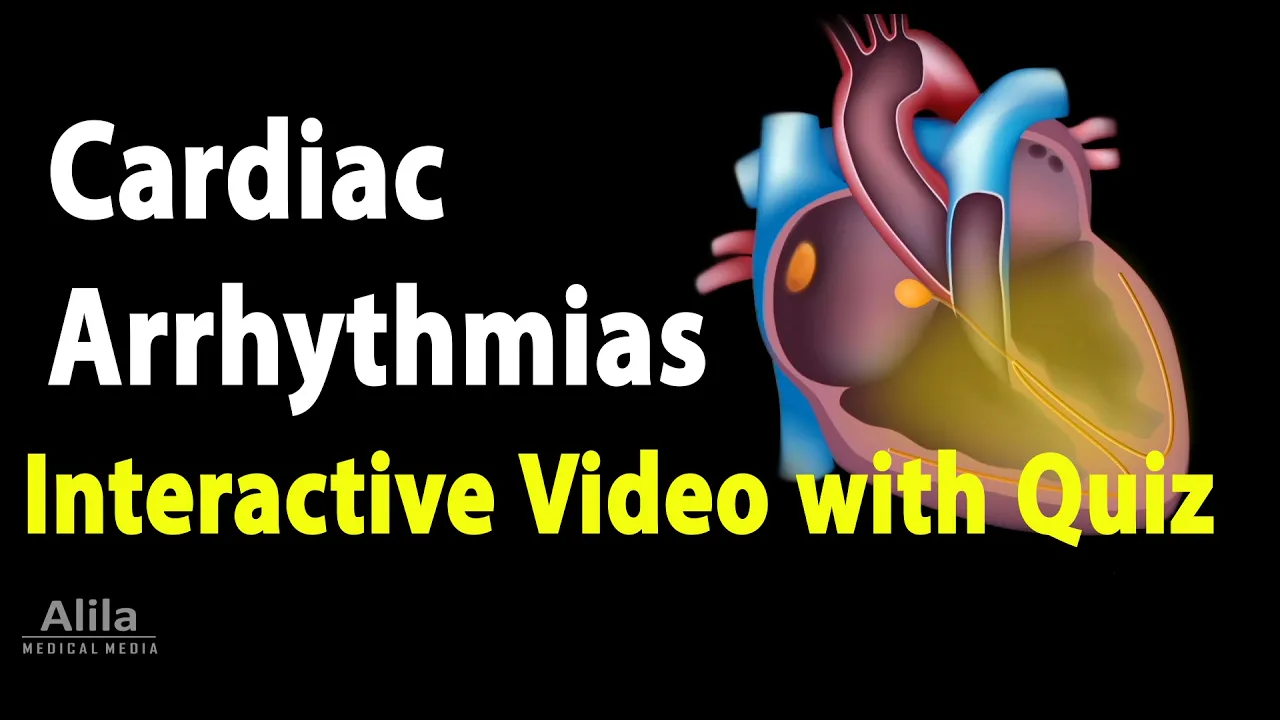
Why this video: This video uses interactive animations to present lethal ventricular rhythms (including Ventricular Tachycardia and Ventricular Fibrillation). It shows how these rhythms arise within the ventricular muscle wall and explains how they differ from supraventricular patterns.
Module 4 Knowledge Checkpoint
- Diagnose a Mobitz Type I (Wenckebach) block by identifying progressive PR prolongation until a QRS drops, and contrast it with the constant PR intervals of a Mobitz Type II block.
- Define the ECG hallmarks of Atrial Fibrillation (absent P-waves, irregularly irregular R-R intervals, narrow QRS complexes).
- Differentiate between Monomorphic Ventricular Tachycardia, Polymorphic Ventricular Tachycardia (Torsades de Pointes), and Ventricular Fibrillation.
- Recognize when a patient with a conduction block requires immediate cardiac pacing or emergent defibrillation.
Module 5: Ischemia, Infarction, and Hypertrophy
This final module focuses on the electrophysiological signs of muscle damage and structural changes. You will study standard ECG criteria to differentiate STEMI from NSTEMI, analyze bundle branch blocks, and learn to diagnose left and right ventricular hypertrophy.
Recommended Videos

Why this video: This clinical lecture clarifies STEMI and NSTEMI ECG criteria. It details the J-point elevation thresholds (including contiguous lead rules) and provides a clear explanation of how ST elevations present alongside reciprocal ST depressions in opposite leads.

Why this video: An illustrated breakdown of Bundle Branch Blocks (BBB). This video explains how conduction blocks in either the left or right main bundle branches widen the QRS complex () and change the shape of the QRS in leads V1 and V6.
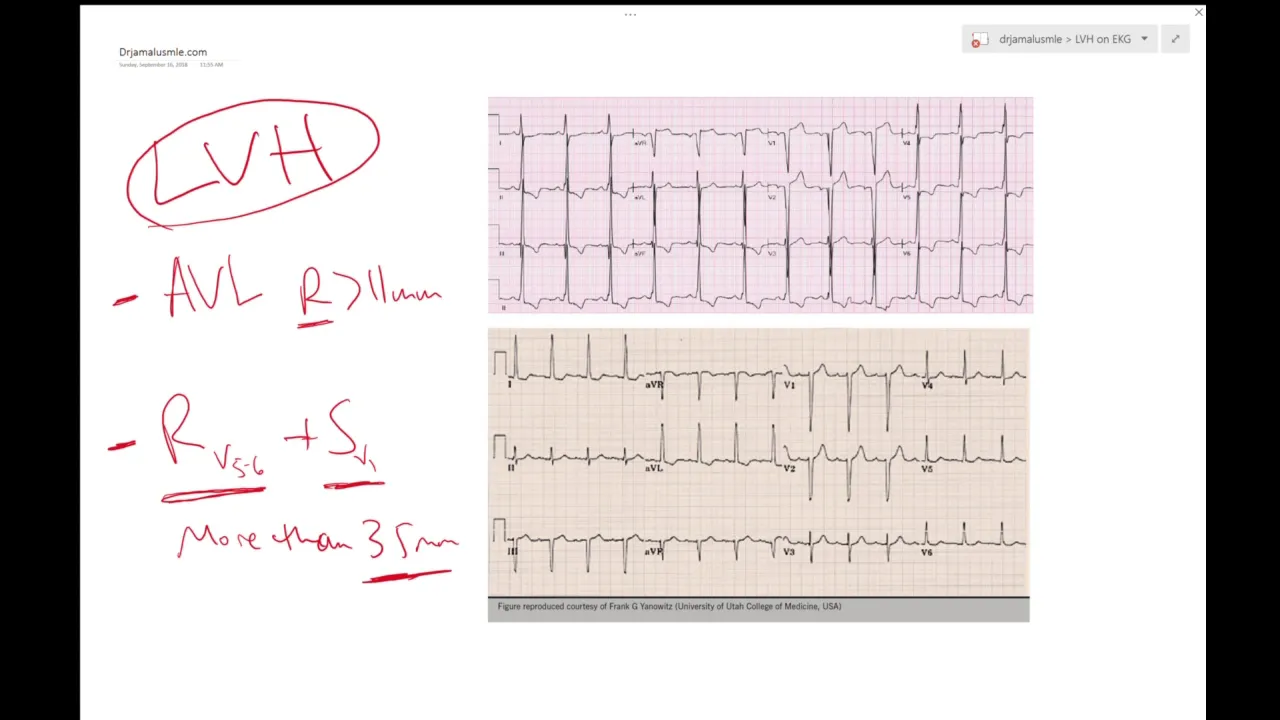
Why this video: A clear explanation of Left Ventricular Hypertrophy (LVH). It highlights key diagnostic methods, focusing on the Sokolow-Lyon criteria (where the depth of the wave in V1 plus the height of the wave in V5 or V6 is greater than ).

Why this video: This video addresses a common gap in basic training by focusing specifically on Right Ventricular Hypertrophy (RVH). It covers key ECG signs, including right axis deviation, a dominant R-wave in V1 (), and a corresponding deep S-wave in V5 and V6.
Module 5 Knowledge Checkpoint
- State the anatomical criteria for diagnosing a STEMI (ST elevation at the J point in contiguous leads, with gender-specific rules for V2-V3).
- Identify reciprocal ST-segment depression in opposite leads during an acute STEMI (e.g., ST elevation in II, III, aVF with depression in I, aVL).
- Differentiate Left Bundle Branch Block (LBBB) from Right Bundle Branch Block (RBBB) using the "WiLLiaM MaRNoY" or "V1 M vs. W" morphology systems.
- Apply the Sokolow-Lyon criteria to diagnose Left Ventricular Hypertrophy ().
- Spot Right Ventricular Hypertrophy by identifying a dominant R wave in lead V1 () accompanied by right axis deviation.
Course Map
Key People Index
- Dr. Zainab Vora (Cerebellum Academy): A specialist in medical licensing exam preparation. She is known for developing quick, high-yield clinical rules, including the "300 heart rate" rule used under exam pressure.
- Dr. James Gill (Clinical Lecturer): Known for clear clinical skill demonstrations. He focuses on the practical mechanics of standard 12-lead electrode placement to help reduce baseline noise and electrode misplacement in practice.
- Dr. Waqas Fazal (MedNerd): A medical educator recognized for illustrating complex 12-lead vectors and ventricular pathology, particularly in detailing Right Ventricular Hypertrophy (RVH) criteria.
- Dr. Najeeb: A medical lecturer famous for detailed, whiteboard-style illustrations. He specializes in explaining the underlying cardiac physiology and ion channels that drive ECG changes.
Final Self-Assessment
Test your understanding of the concepts across the entire curriculum. You should be able to confidently check every box below before interpreting ECGs in a clinical setting.
- Anatomy: I can trace a cardiac dipole vector from the base of the heart to its apex and explain why a wave of depolarization moving toward an electrode produces a positive upward deflection.
- Action Potential: I can explain the primary difference between a pacemaker action potential (SA node/AV node) and a contractile myocyte action potential (ventricle/atrium), including which channels drive depolarization in each.
- Grid Math: I can calculate irregular ventricular heart rates using a 10-second strip and regular ventricular heart rates using the 1500 and 300 rules.
- Lead Mechanics: I can locate the standard anatomical sites for the six chest leads (V1–V6) and identify which coronary artery supplies the muscle tissue viewed by each lead group (Lateral, Inferior, Anterior, Septal).
- Electrical Axis: I can identify a patient's electrical axis (Normal, Left, Right, Extreme) by evaluating the QRS complex polarity in leads I, II, and aVF.
- AV Blocks: I can differentiate First-degree, Second-degree Mobitz I, Second-degree Mobitz II, and Third-degree (Complete) heart blocks based on PR intervals and P-to-QRS relationships.
- Atrial Arrhythmias: I can distinguish Atrial Fibrillation from Atrial Flutter based on rhythm regularity and the baseline morphology between QRS complexes.
- Lethal Ventricular Rhythms: I can recognize Ventricular Fibrillation and differentiate Monomorphic Ventricular Tachycardia from Polymorphic Ventricular Tachycardia (Torsades de Pointes).
- Infarction Criteria: I can list the diagnostic ST-elevation thresholds for STEMI and identify contiguous lead groupings along with their reciprocal changes.
- Conduction Blocks: I can diagnose an LBBB or RBBB using the QRS width (>120 ms) and characteristic morphological patterns in leads V1 and V6.
- Hypertrophy Analysis: I can apply the Sokolow-Lyon criteria to diagnose Left Ventricular Hypertrophy (LVH) and use Lead V1 morphology along with axis shifts to identify Right Ventricular Hypertrophy (RVH).