Tax Policy: Incidence, Efficiency & Structure
Learning Goal: Evaluate the economic incidence and deadweight loss of different tax structures, comparing progressive income taxes, flat consumption taxes, and land value taxes.
- Prerequisites: Basic understanding of high-school-level coordinate graphing. No prior economics coursework required.
- Estimated Total Study Time: 14 Hours
Module 1: Foundations of Market Surplus and Equilibrium
This module establishes the microeconomic foundation of tax analysis. Before analyzing how taxes distort markets, you must master how supply and demand establish market equilibrium in a competitive market, and understand how to define and measure consumer surplus, producer surplus, and allocative efficiency.
Recommended Videos
-
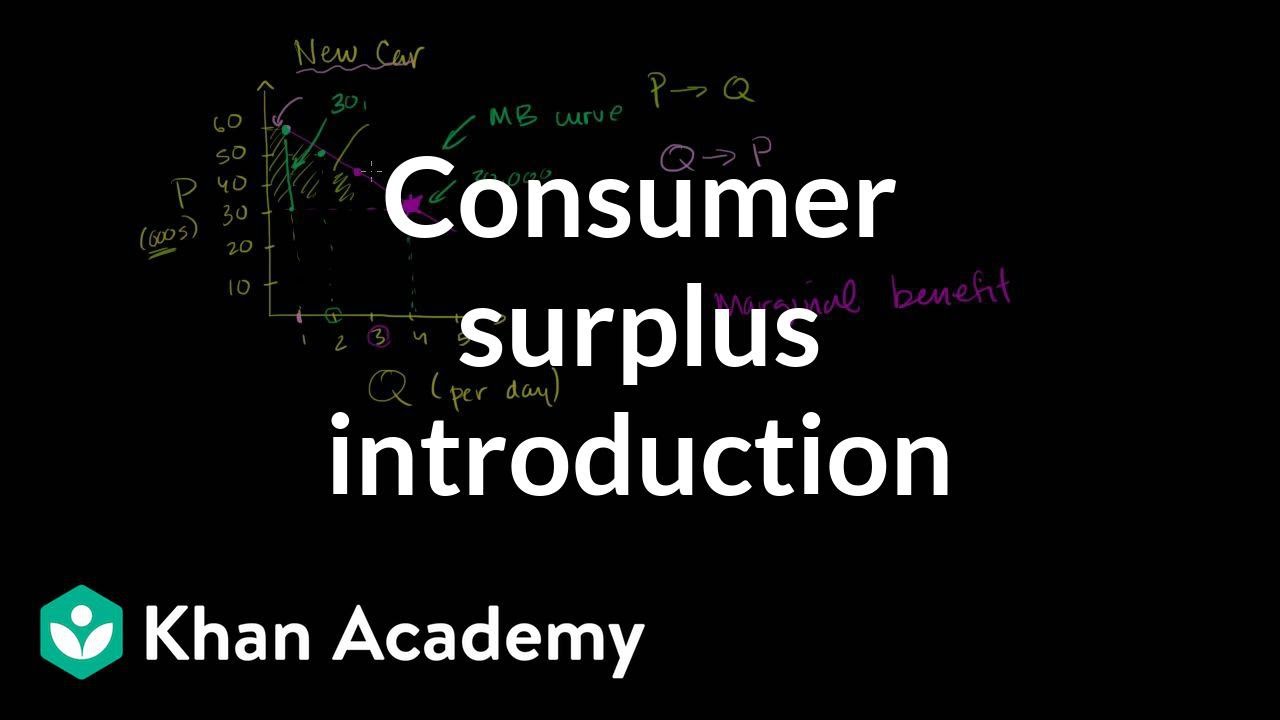
Why this video: Sal Khan provides an intuitive, step-by-step introduction to the concept of consumer surplus. He illustrates how willingness-to-pay translates into demand and explains how to calculate the surplus value consumers gain when buying a good at market price.
-
Knowledge Checkpoint:
- Define "willingness-to-pay" and explain its relationship to the demand curve.
- Calculate consumer surplus as the area below the demand curve and above the market price.
- Explain how a change in market price affects the total consumer surplus.

-
Why this video: This video mirrors the consumer surplus lesson by analyzing the seller's side. It breaks down the concepts of marginal cost and willingness-to-accept, illustrating how producer surplus represents the net economic benefit realized by suppliers.
-
Knowledge Checkpoint:
- Define "marginal cost" and explain why the supply curve represents the seller's minimum willingness-to-accept.
- Graphically identify and calculate producer surplus as the area above the supply curve and below the market price.
- Describe the economic difference between total revenue and producer surplus.
-
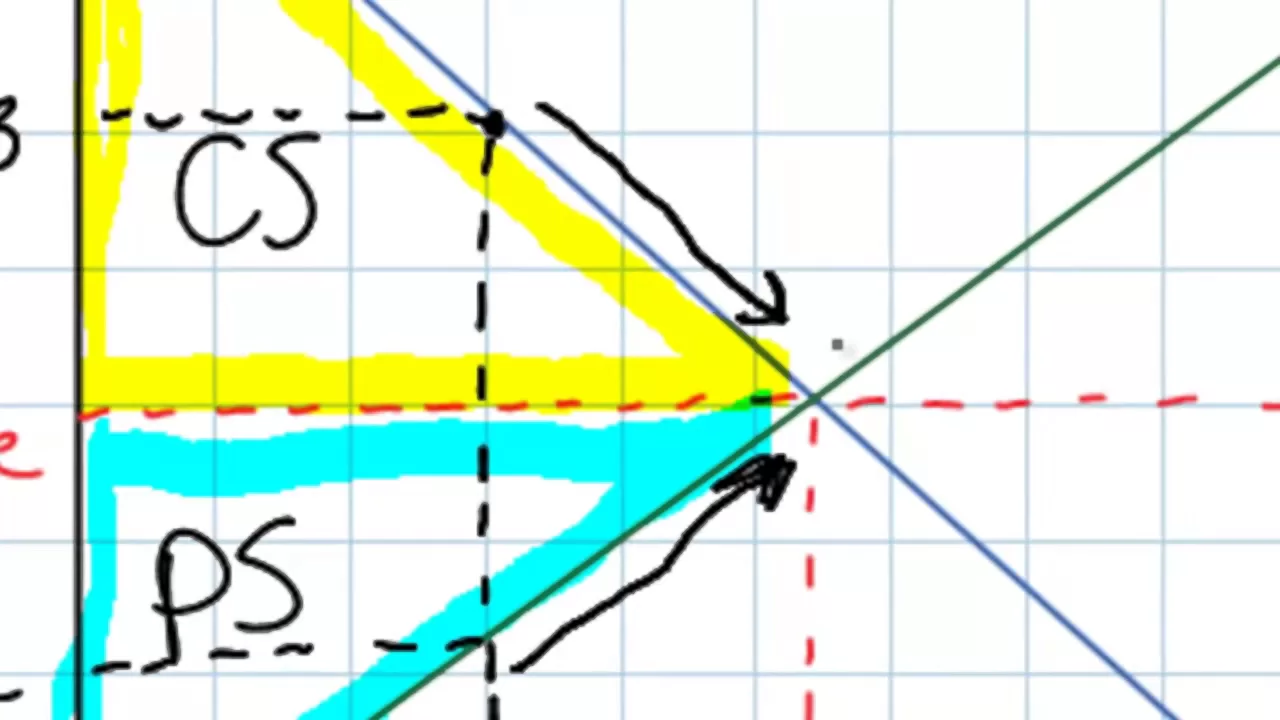
Why this video: This video integrates consumer and producer surplus to define allocative efficiency. It shows why perfectly competitive markets maximize total economic surplus when marginal benefit equals marginal cost (), serving as the baseline for evaluating tax-induced market distortions.
-
Knowledge Checkpoint:
- Define allocative efficiency in terms of marginal benefit () and marginal cost ().
- Identify the point on a supply and demand graph where total economic surplus (social welfare) is maximized.
- Explain why producing more or less than the competitive equilibrium quantity reduces total economic surplus.
Module 2: Tax Incidence and Deadweight Loss Mechanics
This module introduces taxes into competitive markets. You will analyze how a per-unit tax creates a "tax wedge" between the price buyers pay and the price sellers receive. Crucially, you will learn how the relative elasticities of supply and demand determine who actually bears the tax burden (incidence) and how taxes create deadweight loss (deadweight loss or allocative inefficiency).
Recommended Videos

-
Why this video: This video addresses a common gap in economic understanding: how the relative elasticities of supply and demand dictate who bears the burden of a tax, regardless of who writes the check to the government.
-
Knowledge Checkpoint:
- State the general rule of tax incidence: how does elasticity determine which party bears the greater share of a tax?
- Contrast the tax incidence outcome of an elastic demand/inelastic supply market with an inelastic demand/elastic supply market.
- Explain why the legal assignment of a tax (on buyers vs. sellers) does not influence its economic incidence.

-
Why this video: A comprehensive graphical guide to drawing tax wedges, identifying consumer/producer price changes, and shading areas representing consumer tax burden, producer tax burden, government revenue, and deadweight loss.
-
Knowledge Checkpoint:
- Graphically shift supply or demand to represent a per-unit tax and identify the resulting "tax wedge."
- Identify the areas on a standard microeconomics graph that correspond to tax revenue collected by the government.
- Locate the deadweight loss (welfare loss) triangle on a tax graph and explain why it occurs.
-
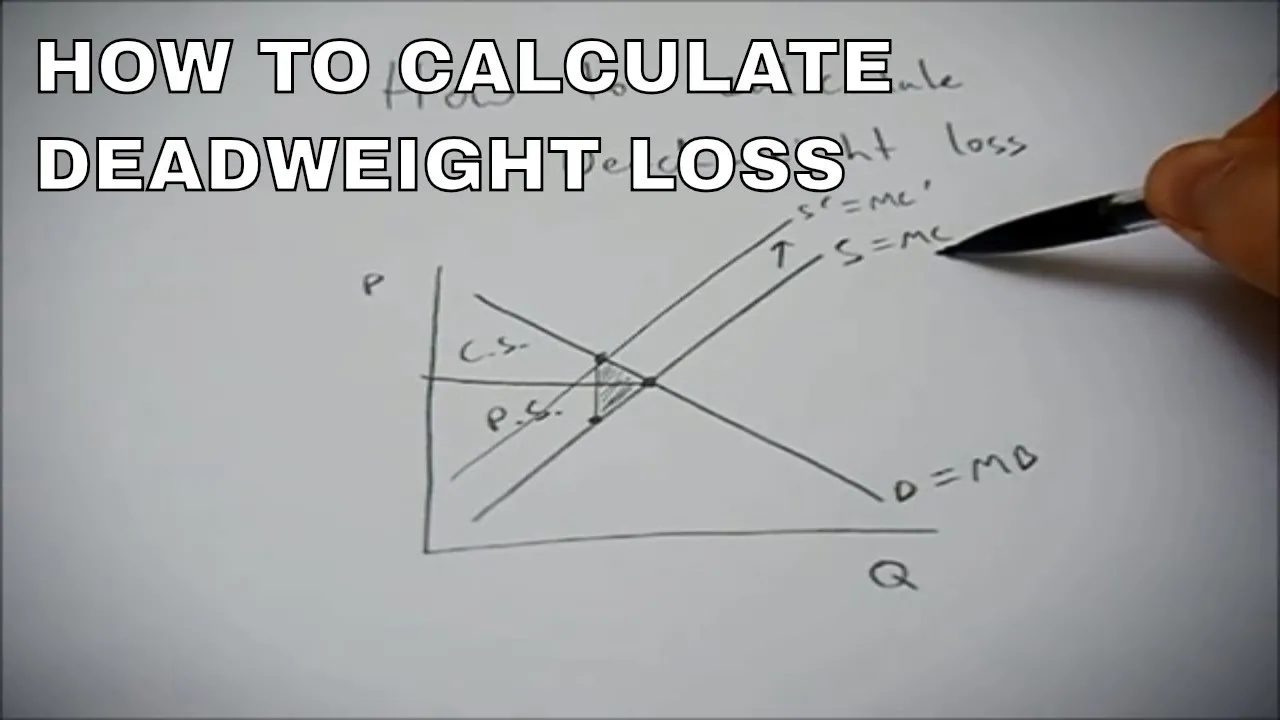
Why this video: This video provides a clear mathematical application of calculating deadweight loss using the geometric area of a triangle () following a tax intervention.
-
Knowledge Checkpoint:
- Write the mathematical formula used to calculate deadweight loss from a linear supply-and-demand graph.
- Explain how a tax reduces the equilibrium transaction quantity, leading to mutually beneficial trades that are prevented by the tax.
- Differentiate between tax revenue (a transfer of surplus) and deadweight loss (a permanent destruction of surplus).
Independent Study Note: To deepen your understanding of how highly elastic versus highly inelastic curves impact the size of deadweight loss, search for: "tax incidence elasticity of supply and demand microeconomics" or "Harberger's triangle elasticity explanation."
Module 3: Progressive Income Taxes: Equity and Incentives
Progressive income taxes are designed to target ability-to-pay by levying higher tax rates on higher income brackets. This module covers the difference between marginal and average tax rates, examines how taxing labor income influences work incentives via substitution and income effects, and analyzes the theoretical limits of revenue generation via the Laffer Curve.
Recommended Videos
-
Why this video: This video uses a mathematical walkthrough to demystify progressive tax brackets. It clarifies why your marginal tax rate applies only to the last dollar earned, while your average tax rate is your total tax liability divided by your total income.
-
Knowledge Checkpoint:
- Explain why a progressive tax system requires marginal tax rates to exceed average tax rates for high-income earners.
- Calculate the total tax liability and average tax rate of an individual navigating a multi-bracket progressive tax schedule.
- Correct the common misconception that "moving up a tax bracket lowers your net take-home pay."
-
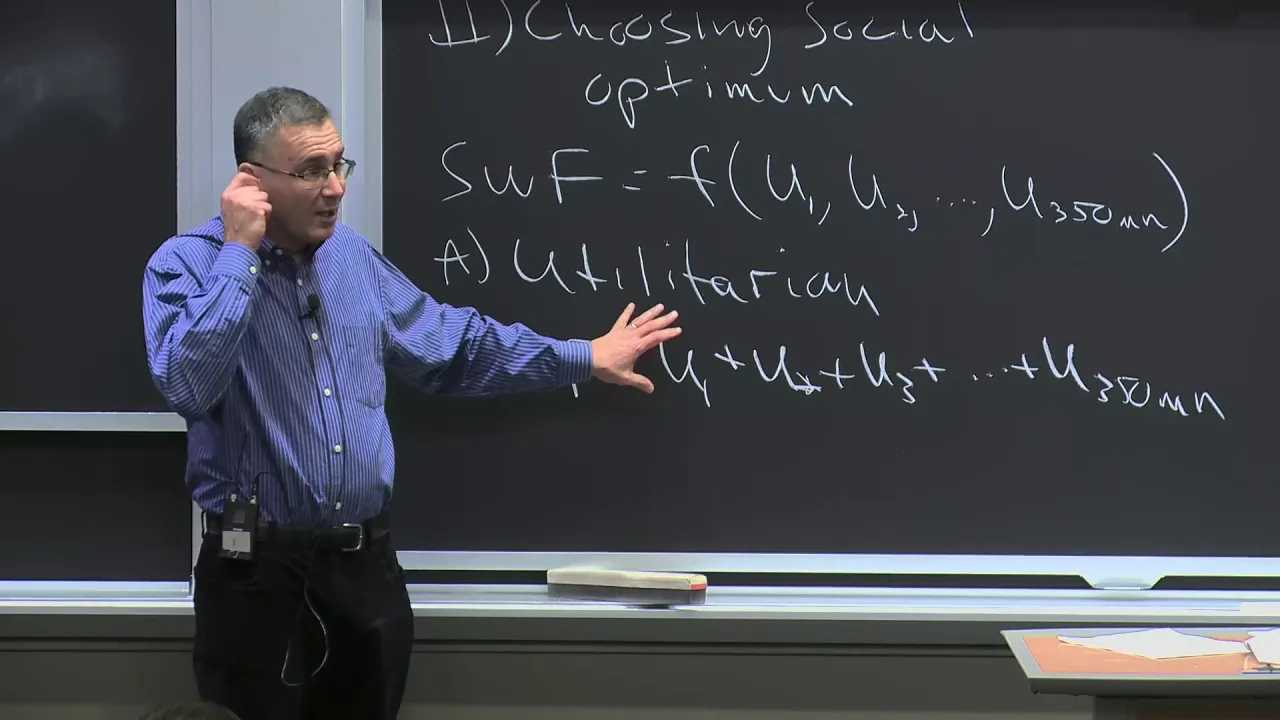
Why this video: This concise MIT lecture excerpt introduces the behavioral distortions of income taxation on labor supply. It explains the tension between the substitution effect (working less because leisure is relatively cheaper) and the income effect (working more to maintain a baseline level of consumption).
-
Knowledge Checkpoint:
- Define the substitution effect of a wage tax and identify its direction on labor supply.
- Define the income effect of a wage tax and identify its direction on labor supply.
- Explain how these competing effects dictate whether an income tax increase will raise or lower total hours worked.
-
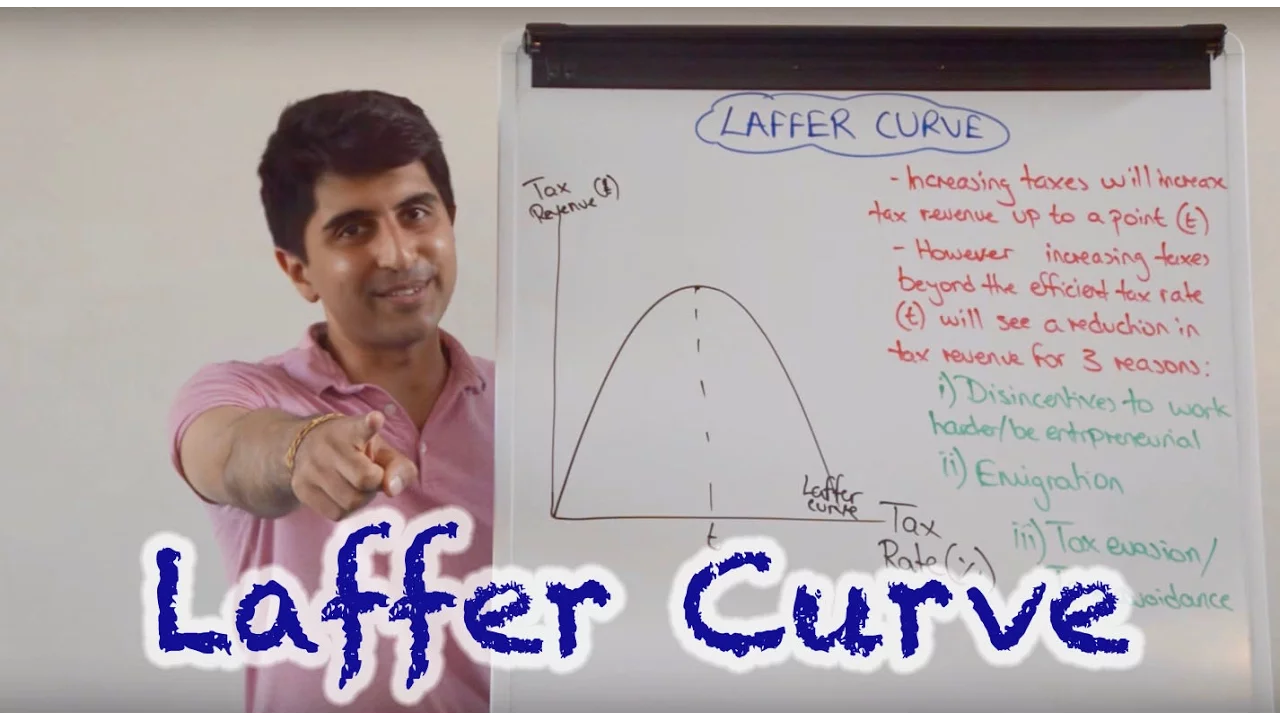
Why this video: A rapid, highly visual explanation of the Laffer Curve, showing the relationship between tax rates and total tax revenue, and highlighting why extreme rates on either end of the spectrum generate zero revenue.
-
Knowledge Checkpoint:
- Draw the Laffer Curve and label the axes correctly.
- Explain why tax revenues are 0%100%$ tax rates.
- Define the "revenue-maximizing tax rate" and explain why setting tax rates past this point is allocatively inefficient.

-
Why this video: For students seeking mathematical rigor, this video models labor supply decisions using consumer utility maximization. It formally shows how progressive tax structures shape budget constraints and alter choices between consumption and leisure.
-
Knowledge Checkpoint:
- Write down the objective function for a consumer choosing between consumption and leisure under a tax regime.
- Describe how progressive tax brackets create non-linear or "kinked" budget constraints.
- Explain how "bunching" occurs at the kinks of progressive tax brackets.
Module 4: Flat Consumption Taxes: VAT and Sales Tax Efficiency
This module explores flat-rate consumption-based taxes, such as retail sales taxes and Value Added Taxes (VAT). You will evaluate why economists often favor consumption taxes for their high economic efficiency—since they avoid taxing savings and investment—while critically analyzing their regressive distributional impacts on lower-income households.
Recommended Videos

-
Why this video: This video uses concrete step-by-step physical examples (e.g., producing and selling a canoe) to explain how a Value Added Tax (VAT) collects revenue at each stage of production and distribution, rather than solely at the final point of retail sale.
-
Knowledge Checkpoint:
- Define "value added" and write the equation to calculate it at a single stage of production.
- Explain how a VAT prevents "tax cascading" (taxing the same value multiple times).
- Differentiate between a retail sales tax and a VAT in terms of administration and collection points.

-
Why this video: This video presents a strong pro-market argument for why taxing consumption is more economically efficient than taxing income. It outlines how income taxes penalize productive work, savings, and capital accumulation, whereas consumption taxes only penalize spending.
-
Knowledge Checkpoint:
- Explain how income taxes double-tax savings and capital gains, reducing long-run investment.
- Contrast how income and consumption taxes shift individual incentives regarding personal savings.
- Identify the efficiency gains associated with substituting a progressive income tax with a flat consumption tax.

-
Why this video: A concise, accessible explanation of why consumption taxes (sales, VAT, excise) are fundamentally regressive, taking a larger percentage of income from low-income families than from wealthy ones.
-
Knowledge Checkpoint:
- Define a "regressive tax" in terms of percentage of income spent.
- Explain why lower-income individuals spend a larger proportion of their income on consumption than wealthy individuals.
- Propose one policy mechanism (e.g., pre-bates or exemptions on essential goods) to mitigate the regressivity of consumption taxes.
Module 5: Land Value Taxes (LVT): The Perfect Tax?
Often described by economists as "the least bad tax," the Land Value Tax (LVT) represents a unique policy mechanism. This module evaluates the theory behind LVT (Georgism), focusing on how a tax levied on the unimproved value of land—which has a perfectly inelastic supply—results in zero deadweight loss and cannot be shifted onto tenants.
Price of Land ($) ^ Supply (S) - Perfectly Inelastic | | P0 |---------------+ (Equilibrium before tax) | | | Tax wedge | <-- Landowners bear 100% of tax burden P_net|-------------+ | | | | Demand (D) +---------------+------------------> Quantity of Land (Fixed) Q0 (Unchanged)
Recommended Videos

-
Why this video: This video delivers the essential microeconomic proof of Land Value Tax: because the physical supply of land is fixed (a vertical supply curve), taxing pure economic land rent generates zero deadweight loss. It connects LVT directly back to the elasticity concepts studied in Module 2.
-
Knowledge Checkpoint:
- Explain why the supply of land is represented as a vertical (perfectly inelastic) curve.
- Use elasticity theory to explain why landowners bear of the tax burden and cannot pass the tax on to tenants.
- Graphically demonstrate why a tax on a perfectly inelastic supply does not create any deadweight loss.
-
Why this video: This video uses intuitive animations to contrast the incentives of LVT against conventional property taxes. It explains that taxing property structures discourages building and maintenance, while taxing land values encourages efficient land utilization.
-
Knowledge Checkpoint:
- Differentiate between taxing the improved value of a property (buildings) versus the unimproved value of the land.
- Describe the incentive problems associated with typical property taxes.
- Explain how an LVT combats urban blight and land speculation.

-
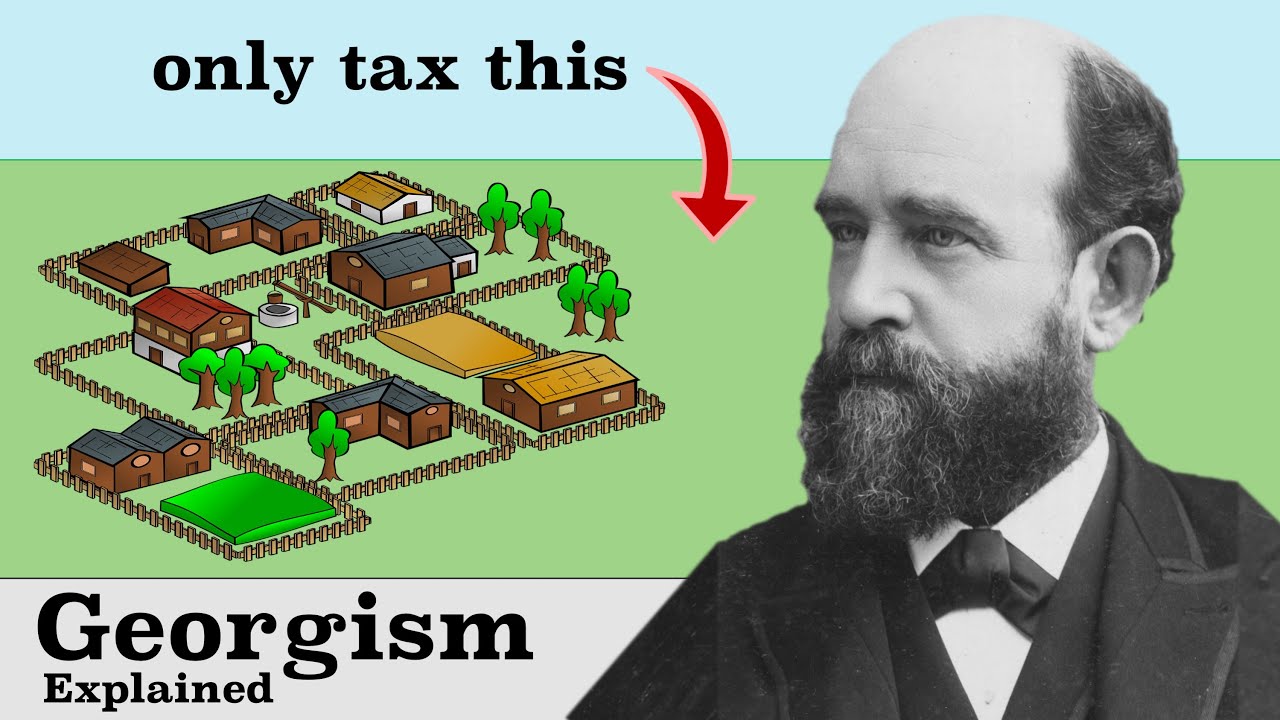
Why this video: A philosophical overview of Georgist economic theory, framing LVT as a market-capitalist approach to private development that pairs with a socialist perspective on natural resource and land rents.
-
Knowledge Checkpoint:
- Define "Georgism" and identify its primary developer, Henry George.
- Explain the ethical and economic argument that land values are socially created (by nearby public infrastructure and community growth) rather than individually created.

-
Why this video: A fascinating historical deep-dive into Elizabeth Magie's creation of "The Landlord's Game"—the direct precursor to Monopoly. It provides context on how the game was originally designed as a pedagogical tool to demonstrate the rent-extraction problems of land monopoly and the Georgist solution of a single land tax.
-
Knowledge Checkpoint:
- Explain how "The Landlord's Game" was designed to illustrate the difference between earned income (labor/capital) and unearned rent (land ownership).
- Describe the economic outcome of land monopolies as demonstrated in the game's original ruleset.
Independent Study Note: To trace the formal mathematical proofs of land rent and capitalization, search for: "Henry George single tax theory mathematical derivation" or "Ricardo's Law of Rent land value tax."
Module 6: Comparative Tax Policy and the Trade-Offs
This final module synthesizes your knowledge of progressive income, flat consumption, and land value taxes. It applies optimal tax theory to evaluate how governments must balance three conflicting policy criteria: microeconomic efficiency (minimizing behavioral distortions), social equity (vertical and horizontal fairness), and administrative feasibility (collection costs and tax evasion).
Recommended Videos

-
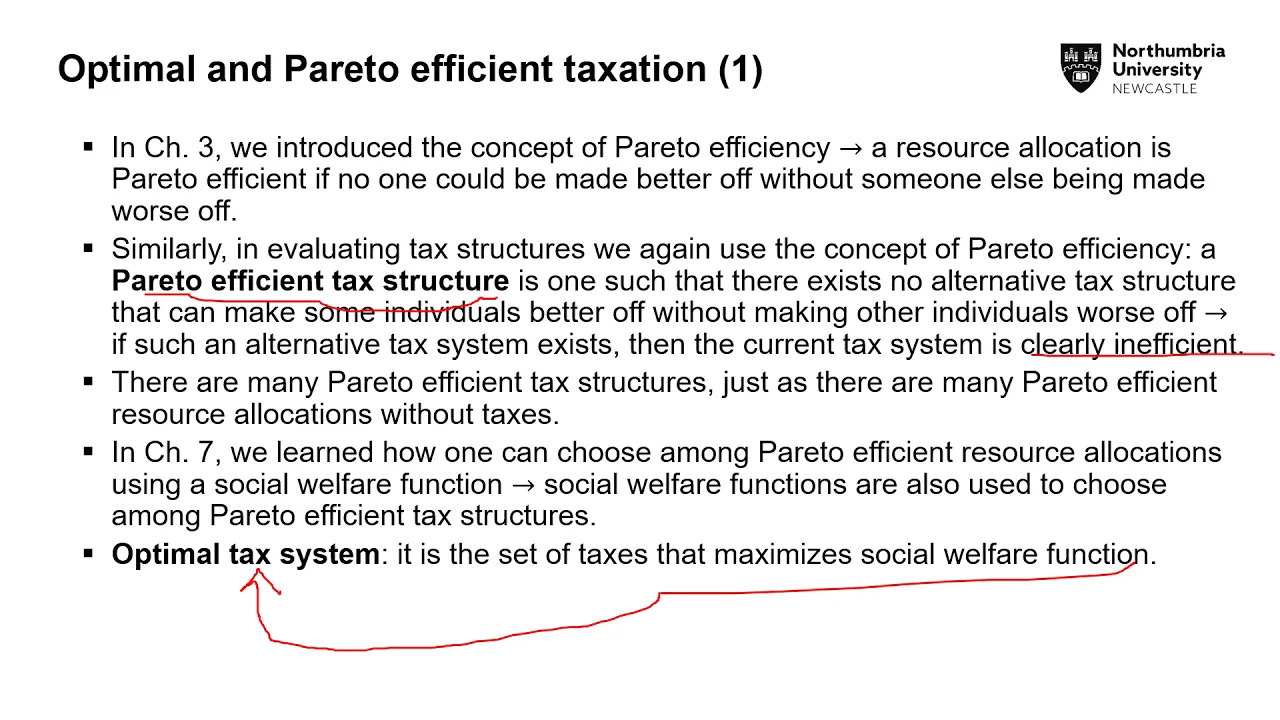
Why this video: A rigorous, graduate-level lecture from Harvard's Public Economics sequence. It mathematically introduces optimal tax theory, demonstrating how public finance economists formulate social welfare functions to navigate the trade-off between equity and deadweight loss.
-
Knowledge Checkpoint:
- Define "optimal taxation theory" and state its objective function.
- Explain how Ramsey's Rule determines optimal commodity taxes by linking tax rates to inverse demand elasticities.
- Contrast the Mirrlees approach to optimal income taxation with classical commodity taxation models.
-
Why this video: This video provides a structured academic breakdown of the trade-offs in optimal tax design. It analyzes why a "lump-sum tax" is perfectly efficient (zero behavioral distortion) but highly unpopular due to horizontal and vertical equity concerns, forcing modern systems to rely on second-best options.
-
Knowledge Checkpoint:
- Explain why a lump-sum tax (head tax) produces zero deadweight loss.
- Define "vertical equity" (fairness across different income levels) and "horizontal equity" (equal treatment of similar individuals).
- Construct a matrix comparing progressive income taxes, flat consumption taxes, and LVT across efficiency and equity criteria.

-
Why this video: A concise, fundamental recap of the core economic principle: "people face trade-offs." It anchors the entire module's focus on the unavoidable trade-off that governments face between maximizing economic efficiency and promoting social equity.
-
Knowledge Checkpoint:
- State the "Efficiency vs. Equity" trade-off in the context of tax policy design.
- Give one example of a tax policy that prioritizes efficiency over equity, and one that prioritizes equity over efficiency.
Independent Study Note: Comprehensive, multi-tax comparison tables are rare in single video formats. To consolidate your synthesis, search for academic reviews using terms like: "Mirrlees Review optimal tax structures" or "comparative analysis progressive income vs consumption vs land value tax."
Course Map
Key People Index
- Henry George (1839–1897): An American political economist and social reformer. He developed Georgism, arguing that while individuals should own the value they create with labor and capital, the value of land and natural resources belongs equally to the community. He advocated for a single land value tax to replace all other distortive taxes.
- Arthur Laffer (1940–Present): An American supply-side economist. He popularized the Laffer Curve, illustrating the non-linear relationship between marginal tax rates and government revenues, advising the Reagan administration on tax reductions.
- James Mirrlees (1936–2018): A Scottish economist awarded the Nobel Prize in Economic Sciences in 1996. He laid the foundational framework for modern optimal income taxation theory, modeling how to structure progressive income taxes when the government cannot directly observe an individual's innate earning ability.
- Elizabeth Magie (1866–1948): An American writer, feminist, and Georgist. She designed "The Landlord's Game" to educate the public on the economic consequences of land monopolization and the merits of a land value tax. Her game was later adapted, without her receiving proper attribution or royalties, into the commercial game Monopoly.
Final Self-Assessment
Complete this comprehensive self-assessment to verify your mastery of tax policy, incidence, and efficiency.
- Market Surplus: Can you graphically locate and mathematically calculate consumer surplus and producer surplus in an undistorted, perfectly competitive market?
- Allocative Efficiency: Can you explain why a perfectly competitive equilibrium maximizes social welfare, using the terms marginal benefit and marginal cost?
- Tax Wedge: Can you explain why the physical burden of tax collection (on buyers or sellers) does not alter the economic incidence of a tax?
- Elasticity & Incidence: Can you predict who will bear the majority of a tax burden given specific demand and supply elasticities? (e.g., highly elastic demand paired with highly inelastic supply).
- Deadweight Loss Calculation: Can you calculate the deadweight loss of a per-unit tax using a linear supply-and-demand diagram?
- Marginal vs. Average: Can you explain how a progressive income tax operates, and compute both the marginal and average tax rates for a multi-bracket taxpayer?
- Labor Supply Incentives: Can you define the substitution effect and income effect of a wage tax, explaining how they can pull labor supply in opposite directions?
- Laffer Curve: Can you graph the Laffer Curve, explain its economic rationale, and identify the efficiency loss of taxing past the revenue-maximizing rate?
- VAT Mechanics: Can you calculate the value-added tax due at each stage of a multi-firm production chain and explain why it avoids tax cascading?
- Consumption Regressivity: Can you explain why consumption taxes are regressive and outline two fiscal methods used to counteract this regressivity?
- LVT & Inelasticity: Can you explain why taxing the unimproved value of land creates zero deadweight loss using the concept of perfectly inelastic supply?
- Optimal Taxation Trade-Off: Can you write out the core trade-offs of optimal taxation theory, detailing the conflict between vertical equity, horizontal equity, and economic efficiency?